Home » All Articles » Bureau of Meteorology
Category Archives: Bureau of Meteorology
Understanding Fire Weather
Understanding fire weather
05 September 2017
Weather conditions influence the size, intensity, speed and predictability of bushfires—and how dangerous they can be. Large fires can even create their own weather. Understanding fire weather and the peak bushfire seasons across Australia means you can be better prepared for this hazard.
When is fire season?
In Australia, the likelihood of a fire occurring at certain times of year varies by area—but the reality is that fires can happen at any time of year, driven by local conditions.
For northern Australia, the peak bushfire period is during the dry season, which is generally throughout winter and spring. For southern Australia, the bushfire season peaks in summer and autumn.
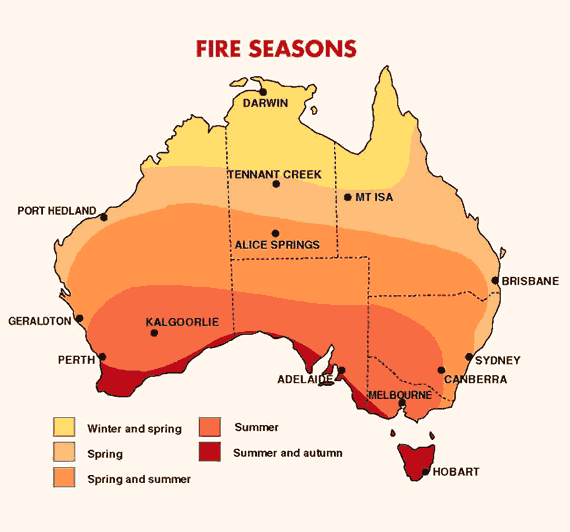
Image: fire seasons in different parts of Australia
What factors influence fire behaviour?
Weather-related factors that contribute to an increased risk of bushfire danger include:
- high temperatures;
- low humidity;
- little recent rain;
- abundant dry vegetation;
- strong winds; and
- thunderstorms.
When the weather is hot, humidity (moisture in the atmosphere) is low and there’s been little recent rain, vegetation dries out and becomes more flammable. Periods of wet weather can encourage vegetation growth, increasing the amount of fuel available—and future bushfire risk, if dry weather follows.
Strong, gusty winds help fan flames and will cause a fire to spread faster across the landscape, reducing the time you have to prepare.
Above the fire, strong winds can carry hot embers long distances. These can start ‘spot’ fires many kilometres ahead of the main fire front.
A change in wind direction can bring a dangerous period of bushfire activity. This is often seen as a trough or cold front (also known as a cool change) shifting the direction of the wind, altering the course of the fire and broadening the fire front.
Lightning, produced by thunderstorms, can ignite bushfires. Large fires can also create their own thunderstorms. These are known as pyrocumulonimbus, and are caused by the heat of the fire forcing the smoke and hot air above it to rise to the point where it cools and condenses into water droplets, eventually forming large clouds. Pyrocumulonimbus can cause erratic, more intense and dangerous bushfire behaviour, including lightning strikes that can cause new fires.
Fire warnings
The Bureau issues fire weather warnings when forecast weather conditions are likely to be dangerous. We work closely with emergency services around the country to keep the community informed.
The Bureau and emergency services use six fire danger ratings to communicate the level of bushfire risk. These ratings help the community know when to put their bushfire survival plan into action.
These ratings are: Low–Moderate, High, Very High, Severe, Extreme and Catastrophic (or Code Red in Victoria). The higher the rating, the more dangerous the conditions are likely to be, and at higher ratings any fire that starts will likely be fast-moving and difficult to control.
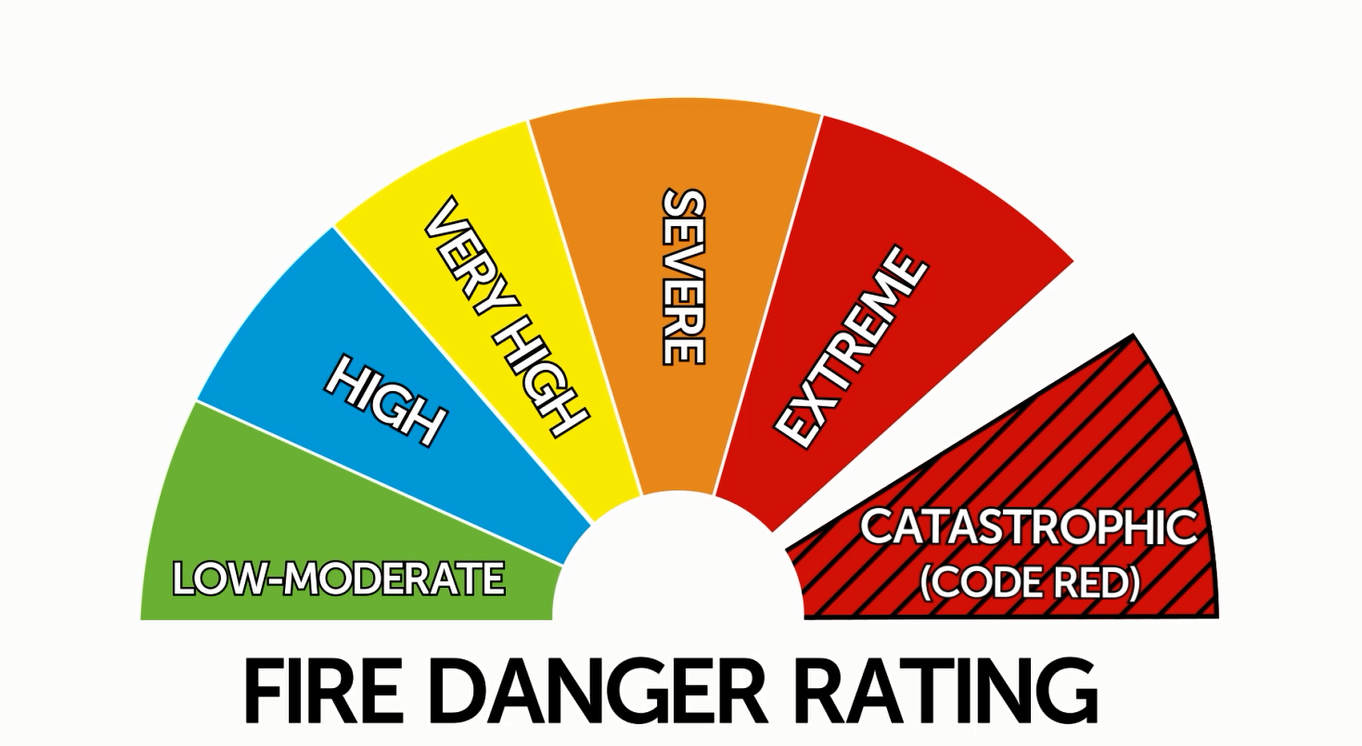
Image: Fire danger ratings used in Australia
What to do when there’s a risk of fire
No matter what the forecast fire rating, if you live in or are travelling to an area that could be threatened by fire, you need to have a bushfire plan in place, so you know what to do if a bushfire starts. On a day when dangerous bushfire activity is more likely, stay in touch with your local fire agency and emergency services via their websites and social media—and tune into emergency broadcasters.
More information
- Fire weather warnings
- Access all current warnings on our website (select your State or Territory and ‘View the current warnings’) or the BOM Weather app (tap the yellow triangle with the exclamation mark). You can also follow your State/Territory’s handle on Twitter.
- Bushfire weather
- Research: how mountain waves can escalate bushfires
Projecting Future Climate – BoM
Global climate models, which are based on the laws of physics, allow scientists to answer questions about our climate.
Scenarios of future greenhouse gas and aerosol emissions are used to drive the climate models. These scenarios are derived to encompass the uncertainty around future anthropogenic emissions including consideration of unknowns in population and economic growth, technological developments and transfer, and political and social change.
The non-linear and chaotic nature of the climate system creates some natural limits to the predictability of climate, such as decreasing skill in weather predictions beyond a few days.
Future climate cannot simply be extrapolated from past climate, and further may depend sensitively on the evolution of future greenhouse gas concentration. Multi-decadal projections are also affected by the chaotic climate system or natural climate variability.
There is a substantial international climate science and modelling community . Around the world, many groups have created global climate models and all of them vary to a lesser or greater degree from each other. This is mainly due to the justifiably different ways some physical processes are mathematically represented in these models.
Global modelling groups perform simulations using the same emissions scenarios and make their results available for further analysis and evaluation. Model evaluation determines how well climate models represent historical climate and forms an integral part of the confidence building exercise for climate change projections.
Confidence in a climate projection is a measure of how plausible the projected range of change is for a given emission scenario. Confidence comes from multiple lines of evidence including physical theory, past climate changes and climate model simulations.
Climate Extremes – BoM
What is an extreme weather event?
An extreme weather event is an event that is rare at a particular place and time of year. Definitions of rare vary, but an extreme weather event would normally be as rare as or rarer than the 10th or 90th percentile of a probability density function estimated from observations.
Recent changes in extreme weather
Globally, the frequency and severity of extreme temperature events has increased since the middle of the 20th century. Patterns of change in extreme rainfall events vary with region. This is consistent with scientific understanding of the physics of a warming climate. Download the IPCC Working Group 1 FAQs for more detail.
In Australia in recent decades, anomalously warm months have occurred more often than anomalously cold months. Many heat-related records were broken in the summer of 2012-13 and in the year of 2013, including Australia’s hottest day, week, month and year averaged across Australia. Extreme summer temperatures during 2012- 13 were unlikely to have been caused by natural variability alone, and such temperatures are now five times more likely due to the enhanced greenhouse effect. Since 2001, the number of extreme heat records in Australia has outnumbered extreme cool records by almost 3 to 1 for daytime maximum temperatures and almost 5 to 1 for night-time minimum temperatures. Heat waves have increased in duration, frequency, and intensity in many parts of the country. For a full discussion, see the Technical Report (Section 4.2.1).
Heavy daily rainfall has accounted for an increased proportion of total annual rainfall over an increasing fraction of the Australian continent since the 1970s (Technical Report Section 4.2.3). Record rainfall totals occurred in many areas during 2010 and 2011, attributable in part to the presence of strong La Niña conditions and higher than average sea surface temperatures to the north of Australia (Technical Report Section 4.2.2).
There is some observational evidence for a decrease in the occurrence of tropical cyclones. However, the short period of consistent observational records and high year to year variability make it difficult to discern clear trends in tropical cyclone frequency or intensity. For a full discussion, see the Technical Report (Section 4.2.7).
Extreme fire weather days have increased at 24 out of 38 Australian sites from 1973-2010, due to warmer and drier conditions. For a full discussion, see the Technical Report (Section 4.2.12).
Causes of recent change (Australia) – BoM
Evidence of human influence on the climate system has strengthened over the past decades.
TEMPERATURE
Regional climate change attribution studies have shown significant consistency between observed increases in Australian temperatures and those from climate models forced with increasing greenhouse gases. By extension, many aspects of warming over Australia are also attributable to the enhanced greenhouse effect.
The mean temperature changes have been accompanied by a large increase in extreme temperatures. Since 2001, the number of extreme heat records in Australia has outnumbered extreme cool records by almost 3 to 1 for daytime maximum temperatures, and almost 5 to 1 for night-time minimum temperatures. Very warm months (those with monthly averaged temperature above the second standard deviation of monthly temperatures from a 1951-1982 reference period) have increased five-fold in the past 15 years. The frequency of very cool months has declined by around a third over the same period.
In Australia, the record hot summer of 2012–13 was examined. The odds of this event occurring were found to have increased five-fold due to human influences. 2013 also saw record-breaking September and spring temperatures and was the warmest calendar year on record. It was found to be virtually impossible to achieve the 2013 calendar year Australian-average temperatures without the presence of human influences on the climate. Additional studies, using various methods, also found that human influences have increased the likelihood or strength of the Australian heat events in 2013.

RAINFALL
Attributing observed regional rainfall changes is a more difficult task than attributing temperature changes. This is especially so in the Australian region, where intrinsic rainfall variability on year-to-year and decade-to-decade timescales is large.
Northern Australian wet season (October to April) rainfall has shown wet and dry decades through the 20th century but with a slight increase indicated in the linear trend in 1900-2012. In recent decades, increases are discernible across northern and central Australia, with the increase in summer rainfall most apparent since the early 1970s. Rainfall during the months of October to April from 1997 to 2013 was very much above average over large parts of the continent. The period 2010 to 2012 recorded the highest 24-month rainfall totals for Australia as a whole, in conjunction with two strong La Nina events.
The southern Australian drying trends are characterised by a 10-20 percent reduction (expressed as a step change or series of step-changes) in cool season (April –September) rainfall across the south of the continent. The rainfall declines have persisted since around 1970 in the south-west and since the mid-1990s in the south-east. It has now been reasonably established that the decline in rainfall has been associated with both fewer rain-bearing systems, and less rainfall from those systems that do cross the region.
While natural variability of Australian rainfall is large, and strongly connected to well-known modes of climate variability, it seems likely from the literature to date that drying across southern Australia cannot be explained by natural variability alone. The most notable proximate driver is the frequency and impact of sea-surface temperature variability associated with the El Niño-Southern Oscillation (ENSO) and the Indian Ocean Dipole (IOD). Specifically, a lack of negative-phase IOD events has been identified as a contributing factor to drying and drought in the south-east since the 1990s.
Expansion of the tropics and contraction of mid latitude storm tracks towards higher southern latitudes (movement of the subtropical and polar jetstreams) have also contributed to cool season rainfall declines in southern Australia. These circulation pattern changes have affected the behaviour of storm tracks moving across southern Australia. Warming also reduces the temperature gradient between the equator and pole, reducing the energy available to mid-latitude weather systems. A contraction of these weather systems toward the pole is partly explainable by both anthropogenic warming and anthropogenic reductions in stratospheric ozone.
South-west Western Australia has experienced a marked decline in the frequency of troughs associated with rainfall since 1975, and an associated increase in weather patterns associated with higher pressure and dry conditions. The decrease in the number of rain-bearing systems crossing the region accounts for about half of the rainfall decline, while the reduction in rainfall from rain-bearing systems accounts for further drying.
The October 2011–March 2012 extreme rainfall over southeast Australia was studied using various attribution methods in separate studies. These found that the record rainfall was most likely attributable to natural variability associated with La Niña, with a small contribution from human influences on the climate system.
SNOW
Snow depths at four Australian alpine sites (Rocky Valley Dam, Spencers Creek, 3-Mile Dam and Deep Creek) have declined from the 1950s to 2001. In 2012, an updated analysis of snow measurements at Rocky Valley Dam in Victoria from 1954–2011 indicated an ongoing trend to lower maximum snow depths and an earlier end of the snow season. The long-term changes are superimposed on considerable year to year variability. The
variability in maximum snow depth can be well explained by maximum temperature and precipitation from June to August. The earlier end of the snow season is dependent on changes in temperature.
TROPICAL CYCLONES
The relatively short time span of consistent records, combined with high year to year variability, makes it difficult to discern any clear trends in tropical cyclone frequency or intensity for the Australian region. For the period 1981 to 2007, no statistically significant trends in the total numbers of cyclones, or in the proportion of the most intense cyclones, have been found in the Australian region, South Indian Ocean or South Pacific Ocean.

FIRE WEATHER
Fire weather is monitored using a McArthur Forest Fire Danger Index (FFDI), which is calculated from daily temperature, wind speed, humidity and a drought factor, at sites with consistent data across Australia. An increase in the annual (July-June) cumulative FFDI is observed across all 38 sites analysed in Australia from 1973 to 2010, and is statistically significant at 16 of those sites, particularly in the south-eastern part of the country. This increase across southeast Australia is characterised by an extension of the fire season further into spring and autumn. There has also been an increase in high FFDI values (90th percentile) from 1973–2010 at all 38 sites, with a statistically significant increase at 24 sites, indicating that extreme fire weather days have become more frequent over time. The FFDI increases are partly driven by temperature increases that are attributable to climate change.
Australian Climate Trends – BoM
The Bureau of Meteorology and other science agencies employ a range of atmospheric, terrestrial and marine sensors to track climatic trends.
For example, the Australian Climate Observations Reference Network – Surface Air Temperature dataset is based on a network of over 100 stations, with data for more than half starting in 1910.
Australia’s climate has warmed since national records began in 1910, especially since 1950. Mean surface air temperature has increased by 0.9°C since 1910. Daytime maximum temperatures have increased by 0.8°C over the same period, while overnight minimum temperatures have warmed by 1.1 °C. The warming trend occurs against a background of year-to-year climate variability, mostly associated with El Niño and La Niña in the tropical Pacific.
The 2014 State of the Climate report states that since 2001, the number of extreme heat records in Australia has outnumbered extreme cool records by almost 3 to 1 for daytime maximum temperatures, and almost 5 to 1 for night-time minimum temperatures.
. SOURCE: State of the Climate, 2014. SOURCE: Bureau of Meteorology and CSIRO") Time series of anomalies in sea-surface temperature and temperature over land in the Australian region. Anomalies are the departures from the 1961–1990 average climatological period. Sea-surface temperature values are provided for a region around Australia (from 4°S to 46°S and from 94°E to 174°E). SOURCE: State of the Climate, 2014. SOURCE: Bureau of Meteorology and CSIRO
Time series of anomalies in sea-surface temperature and temperature over land in the Australian region. Anomalies are the departures from the 1961–1990 average climatological period. Sea-surface temperature values are provided for a region around Australia (from 4°S to 46°S and from 94°E to 174°E). SOURCE: State of the Climate, 2014. SOURCE: Bureau of Meteorology and CSIRO
Very warm months that occurred just over 2 per cent of the time during the period 1951 to 1980 occurred nearly 7 per cent of the time during 1981 to 2010, and around 10 per cent of the time over the past 15 years. At the same time the frequency of very cool months has declined by around a third since the earlier period.
The duration, frequency and intensity of heatwaves have increased across large parts of Australia since 1950. There has been an increase in extreme fire weather, and a longer fire season, across large parts of Australia since the 1970s.
Rainfall averaged across Australia has slightly increased since 1900, with a large increase in north-west Australia since 1970. A declining trend in winter rainfall persists in south-west Australia. Autumn and early winter rainfall has mostly been below average in the south-east since 1990.
Sea-surface temperatures in the Australian region have warmed by 0.9°C since 1900.
Global mean sea level increased throughout the 20th century and in 2012 was 225 mm higher than in 1880. Rates of sea-level rise vary around the Australian region, with higher sea-level rise observed in the north and rates similar to the global average observed in the south and east.
Snow depths at four alpine sites declined from the 1950s to 2001. An updated analysis of snow measurements at Rocky Valley Dam in Victoria from 1954-2011 found a trend to lower maximum snow depths and an earlier end of the snow season. Long-term changes are superimposed on considerable year-to-year variability. The variability in maximum snow depth can be well explained by maximum temperature and precipitation from June to August. The earlier end of the snow season is clearly associated with changes in temperature.
Maleny Apex have funded our scanner to digitise historical data

Hinterland Business Centre provide our domain malenyweather.com