- Hinterland Climate Highlights: July 1958-2000
- Jet Streams
- Weather and Health
- CO2 emissions impact on plants appetite for water
- Your Garden Climate
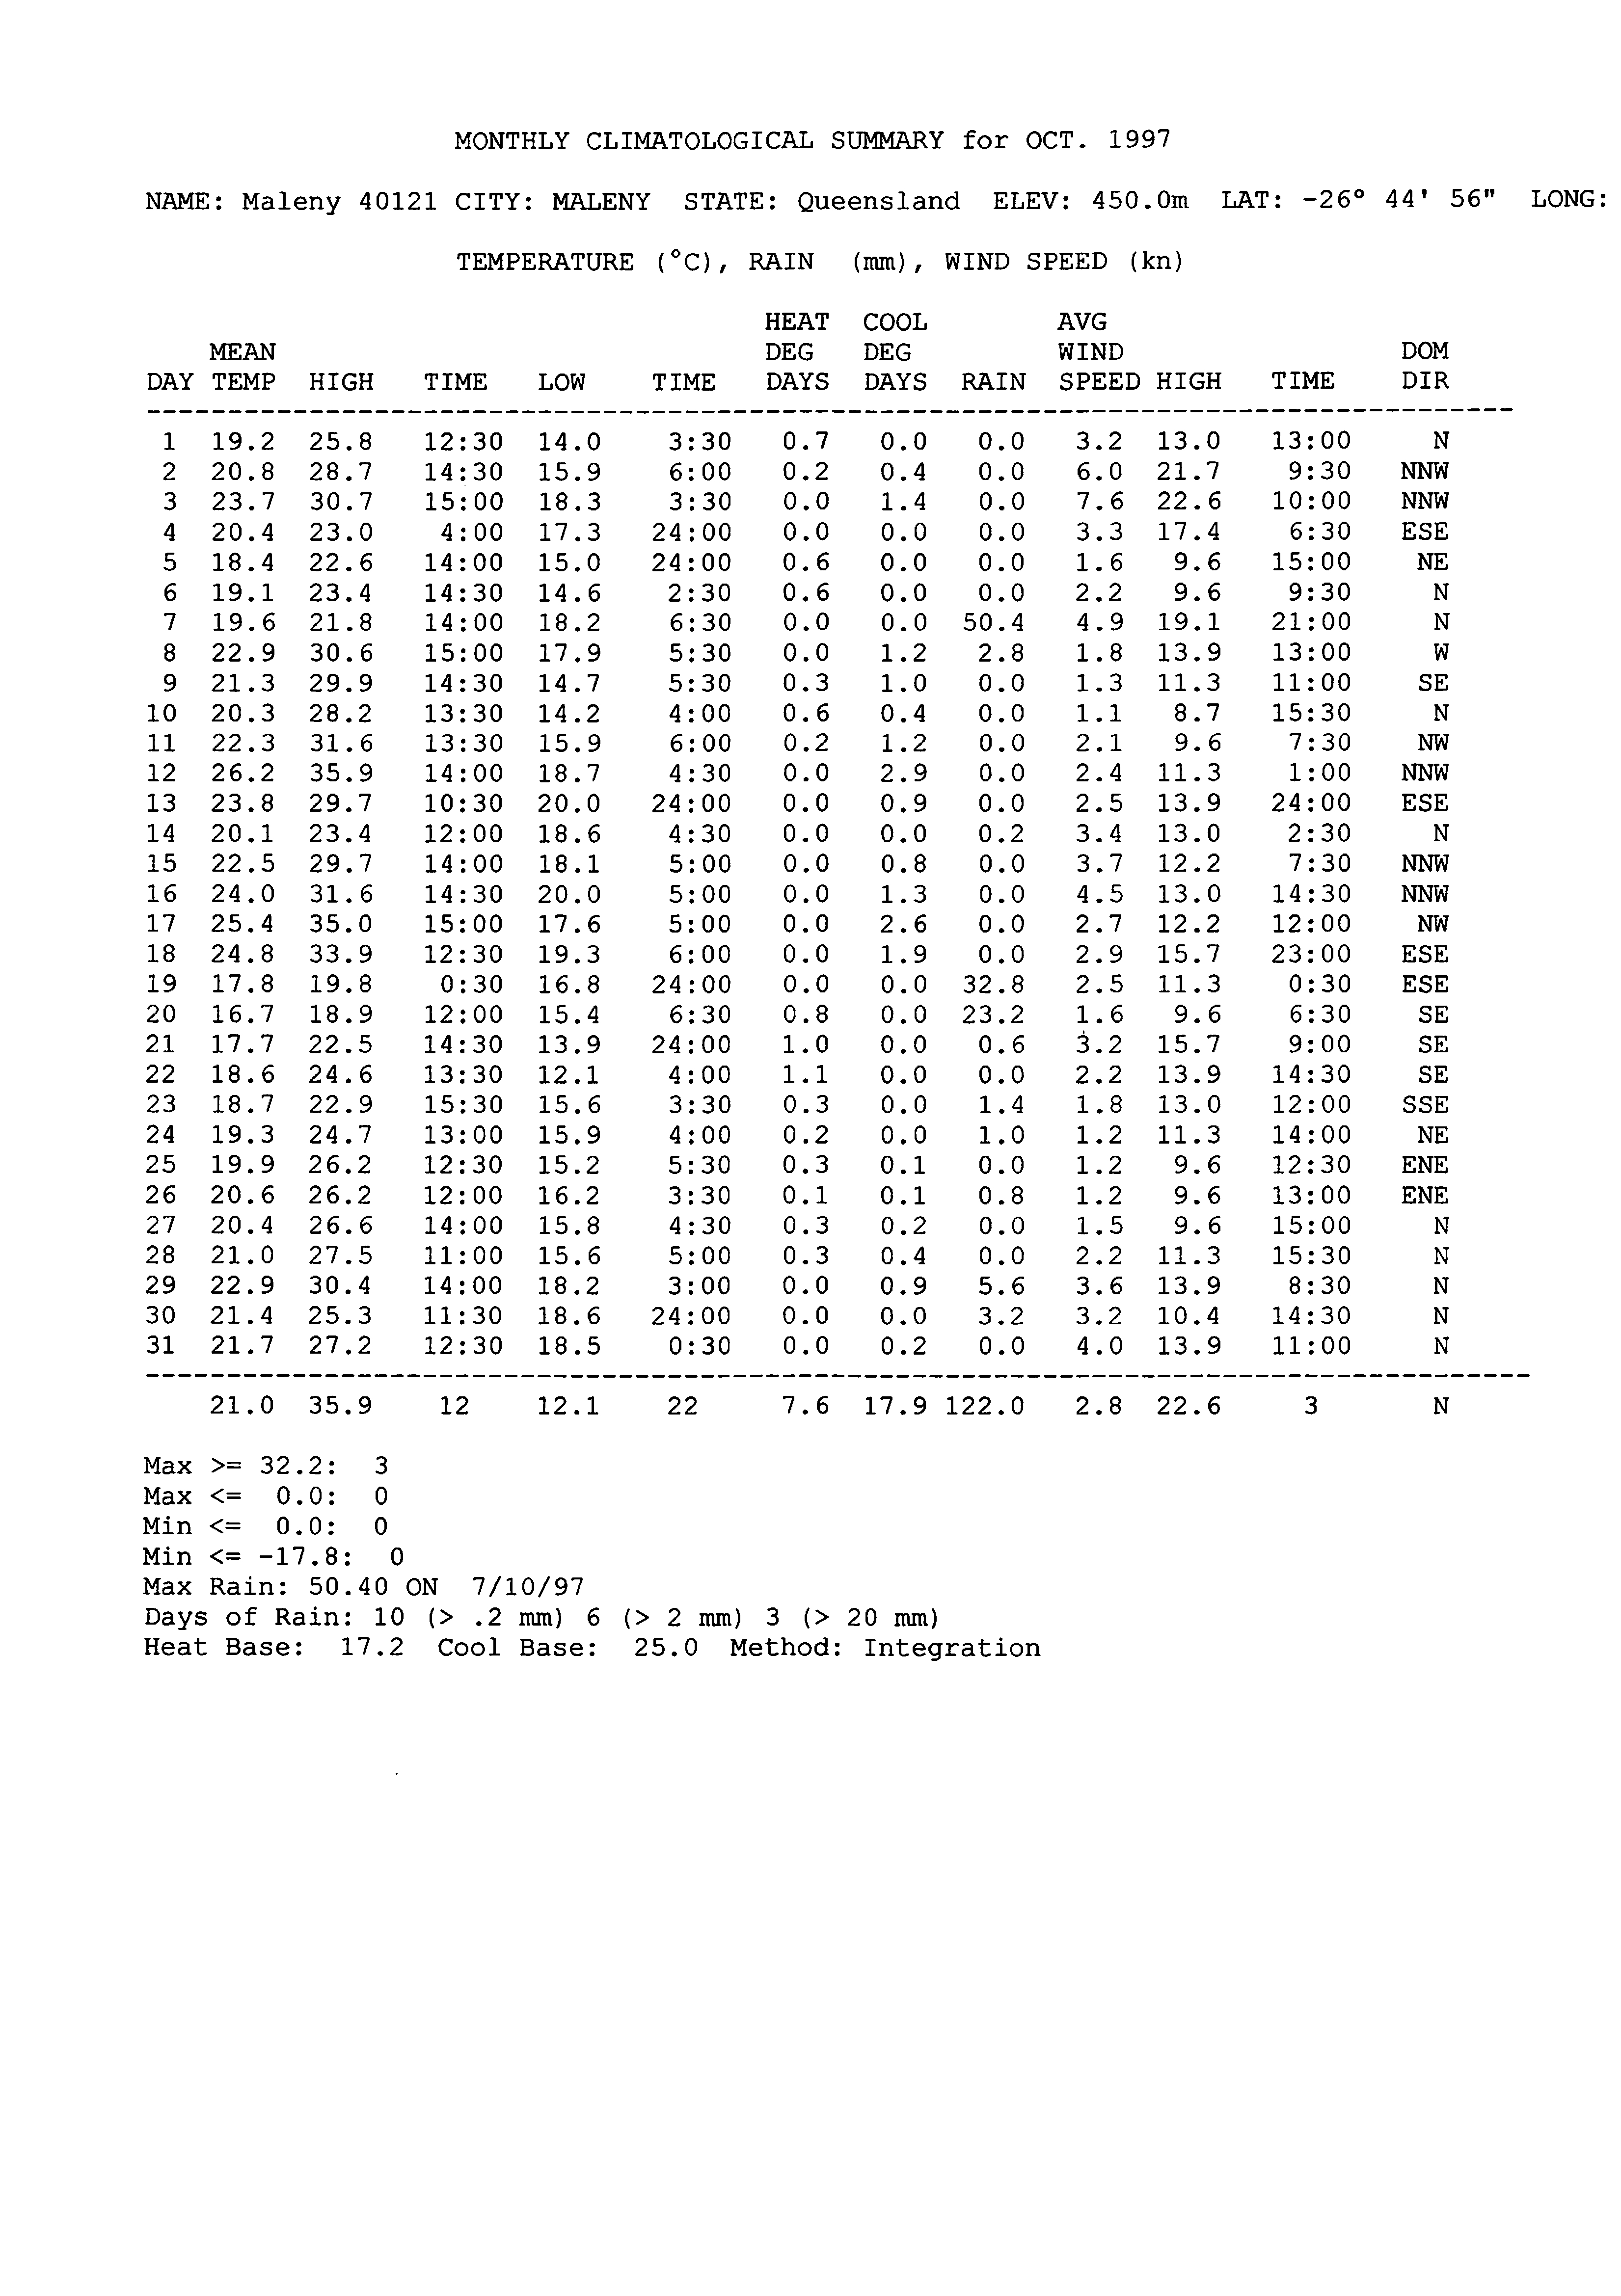
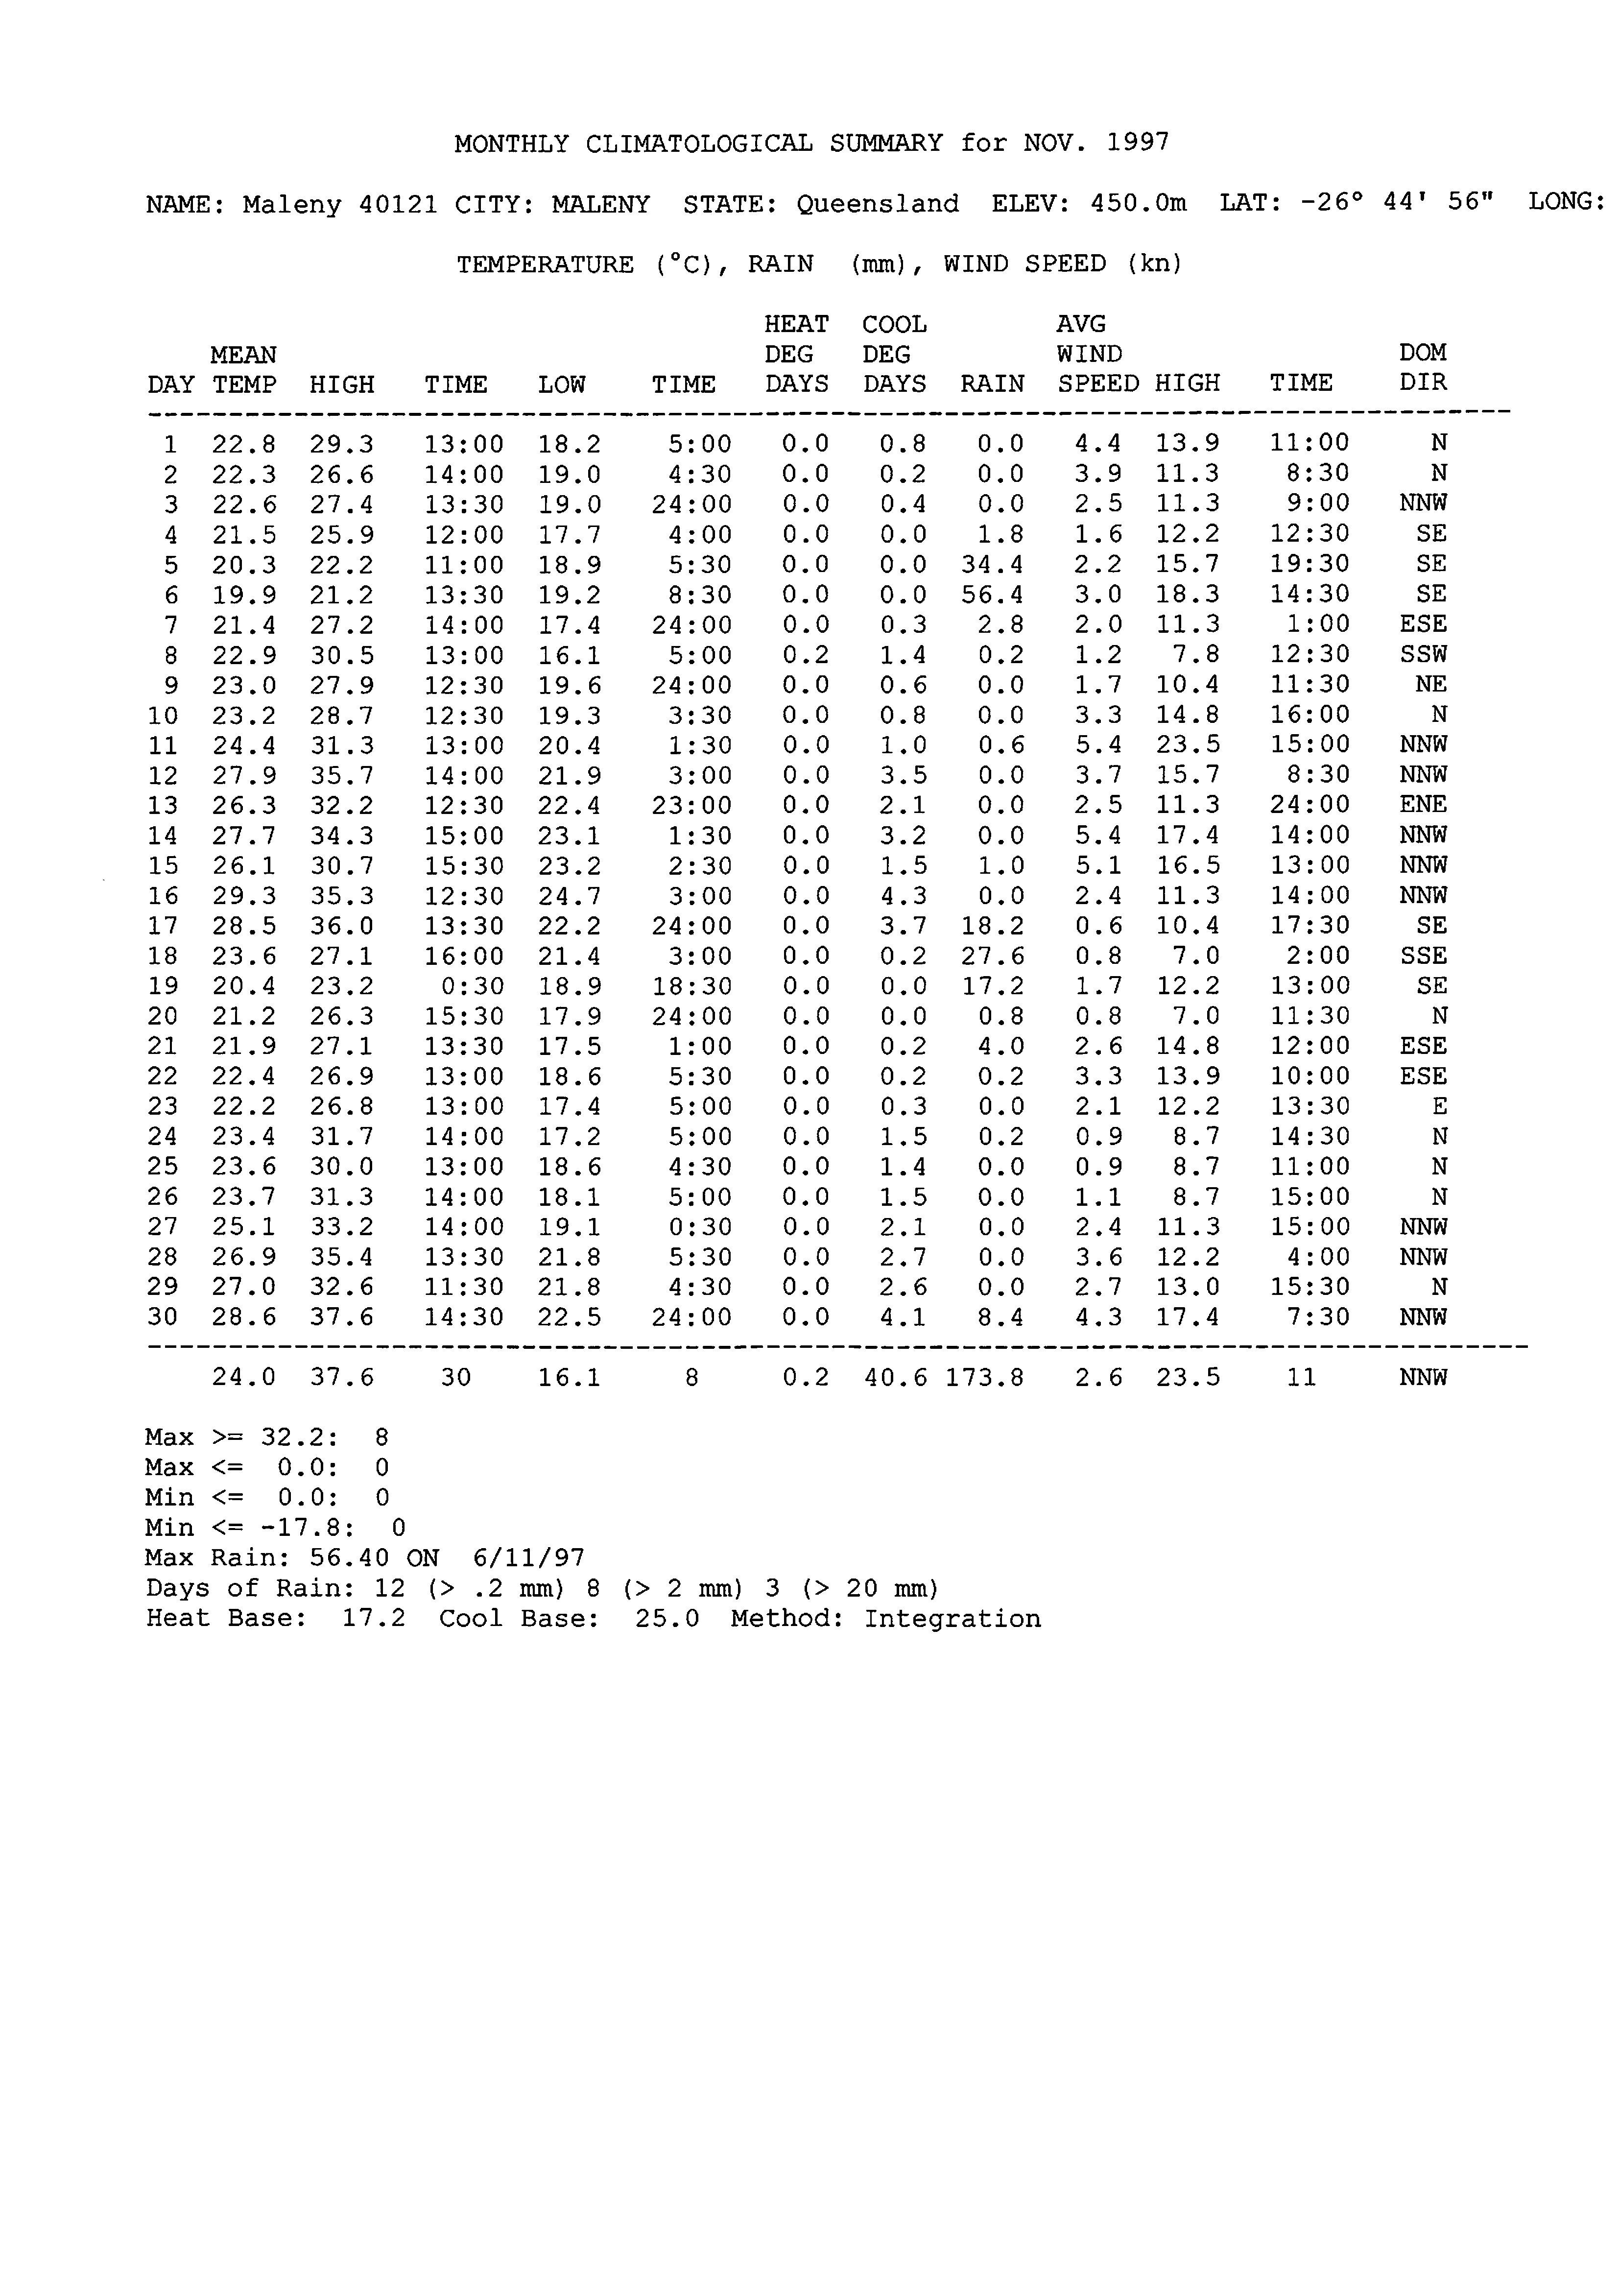
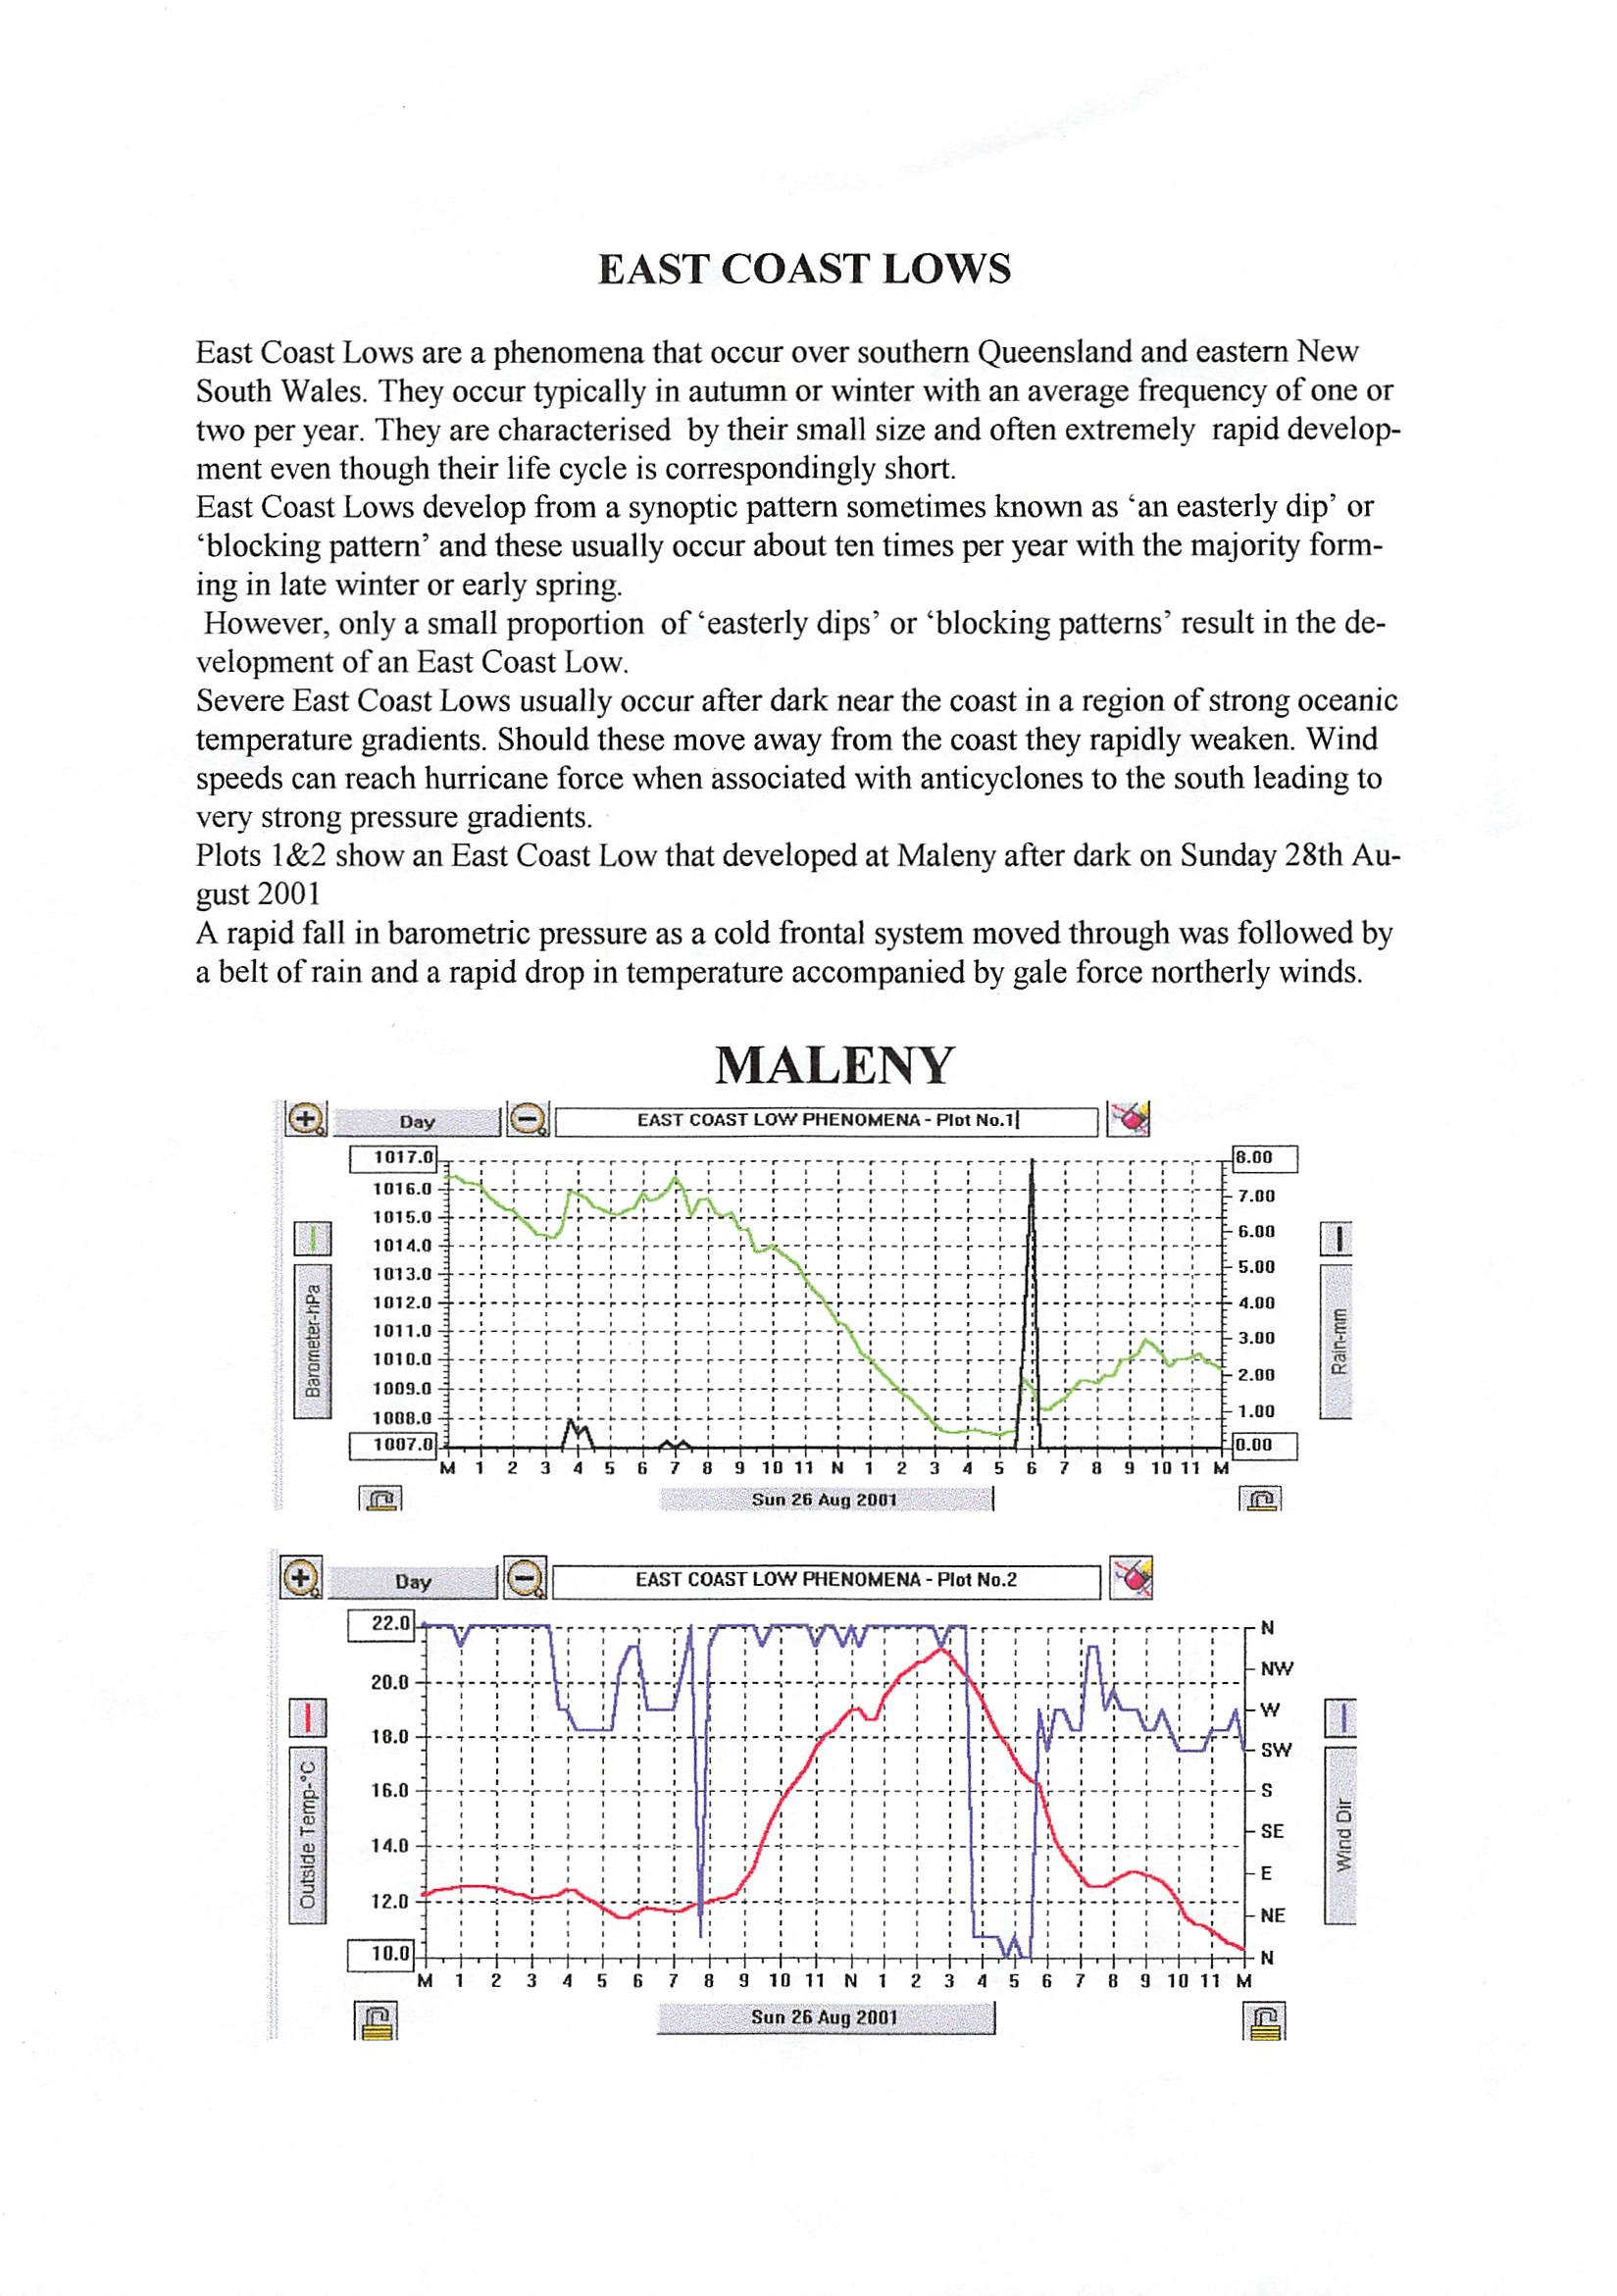
Hinterland Climate Highlights: July 1958-2000
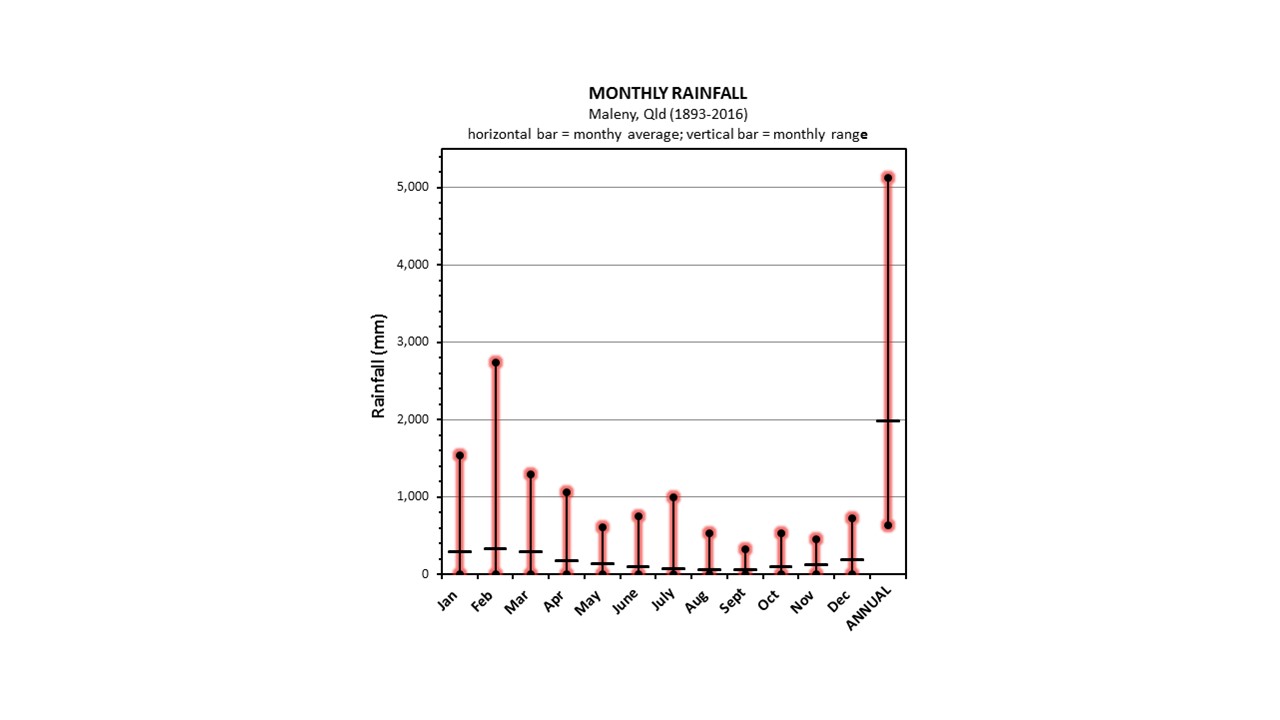
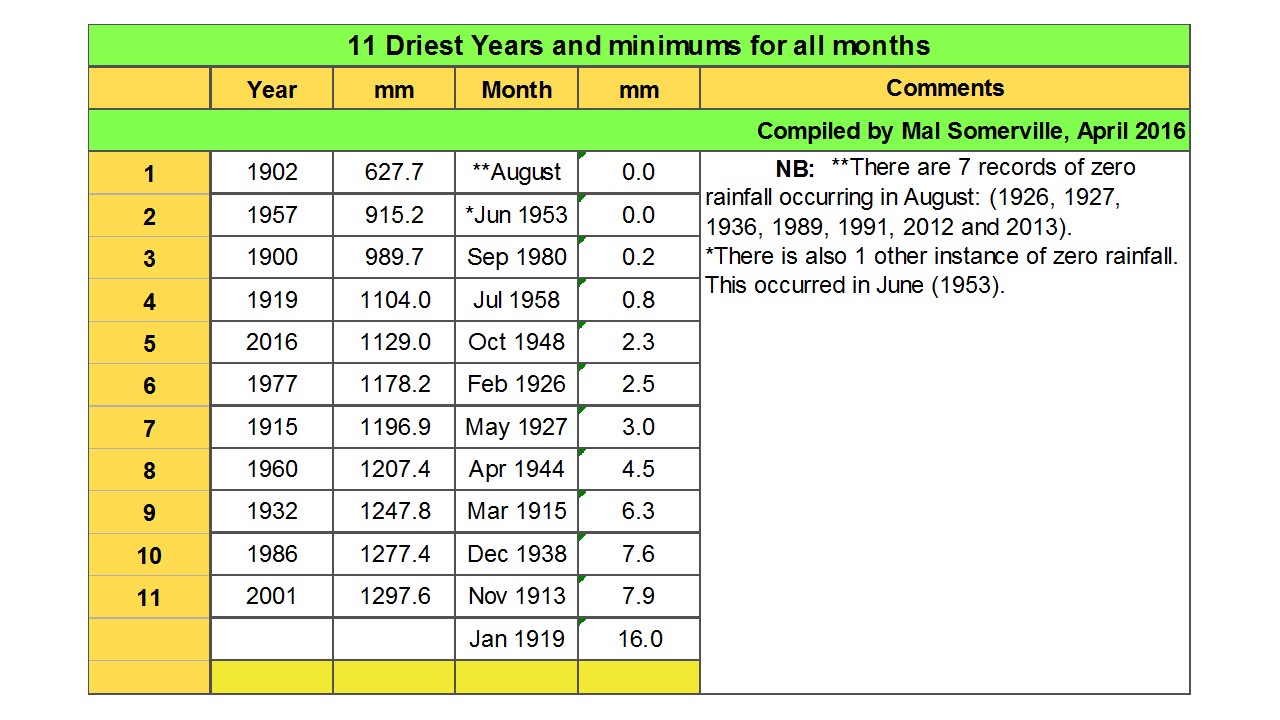
1958: Approximately 0.8 mm is the lowest rainfall recorded at Maleny in July.
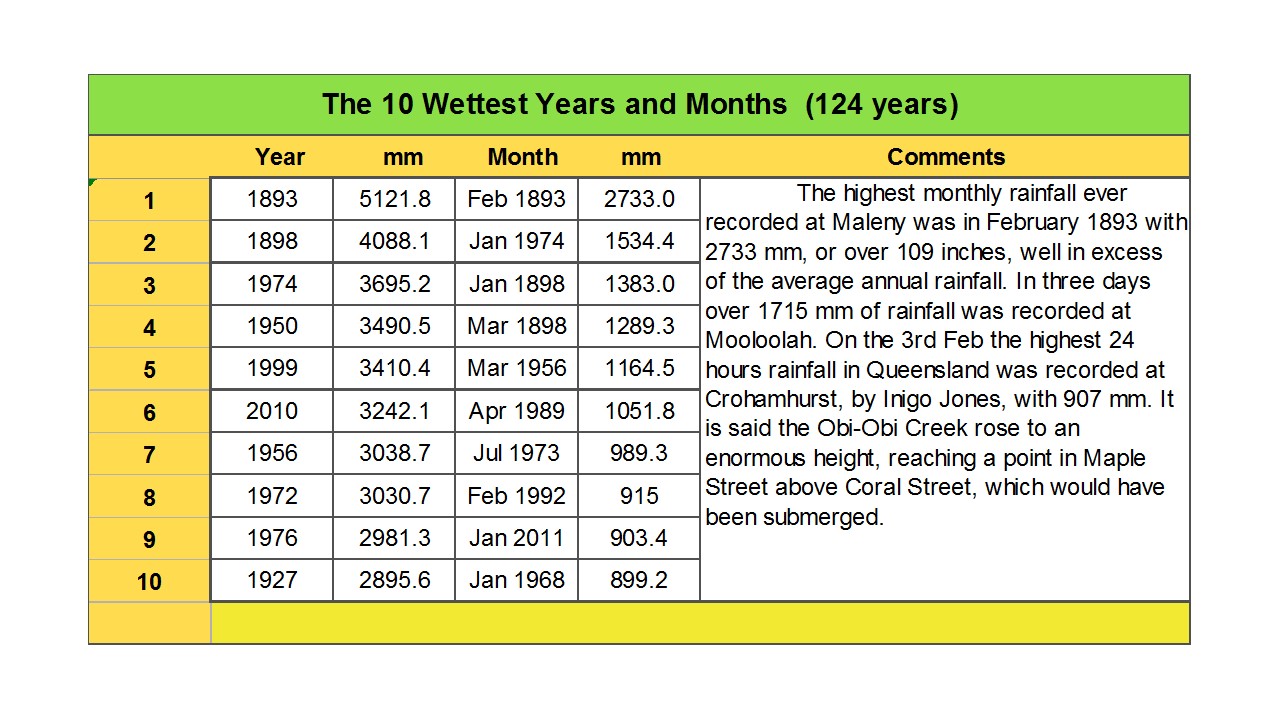
1973: One of the heaviest rainfalls recorded in July was 989.3 mm
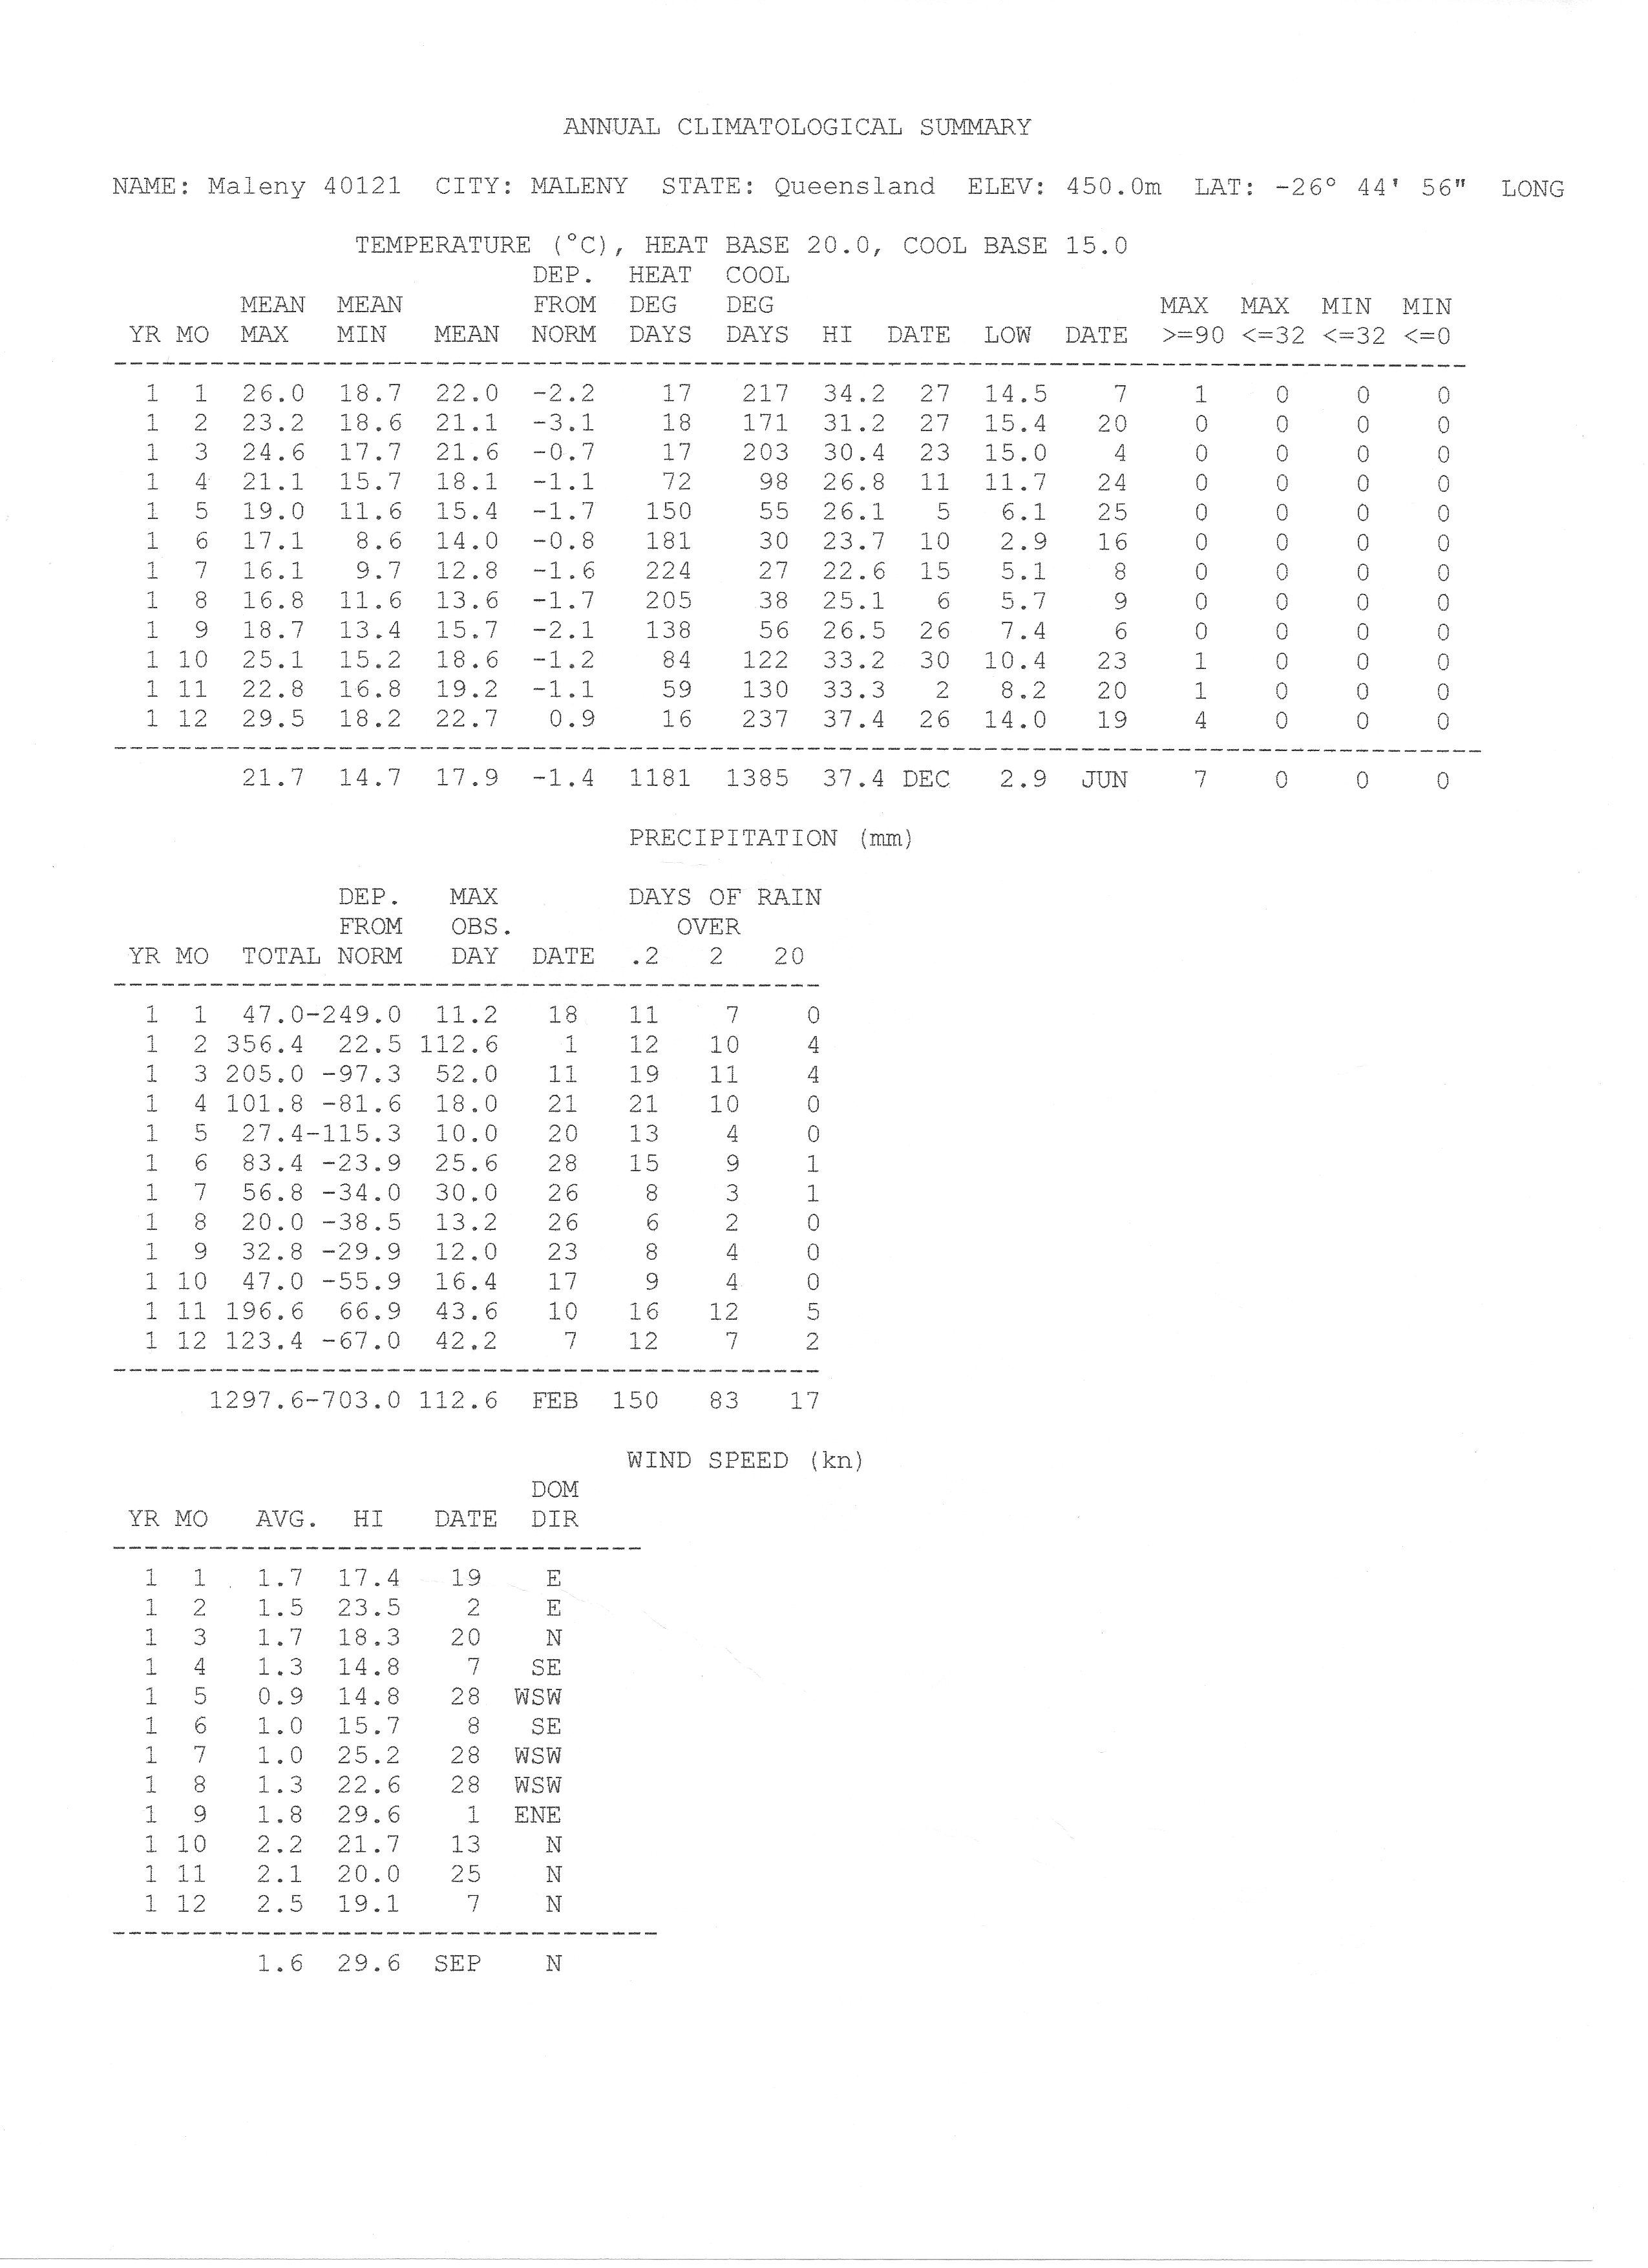
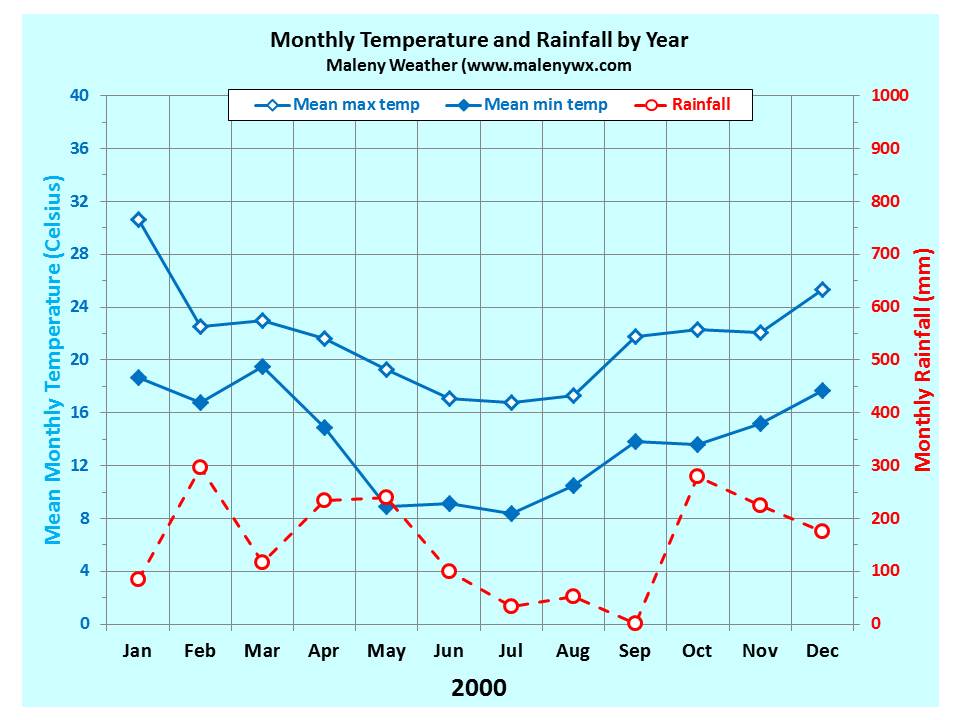
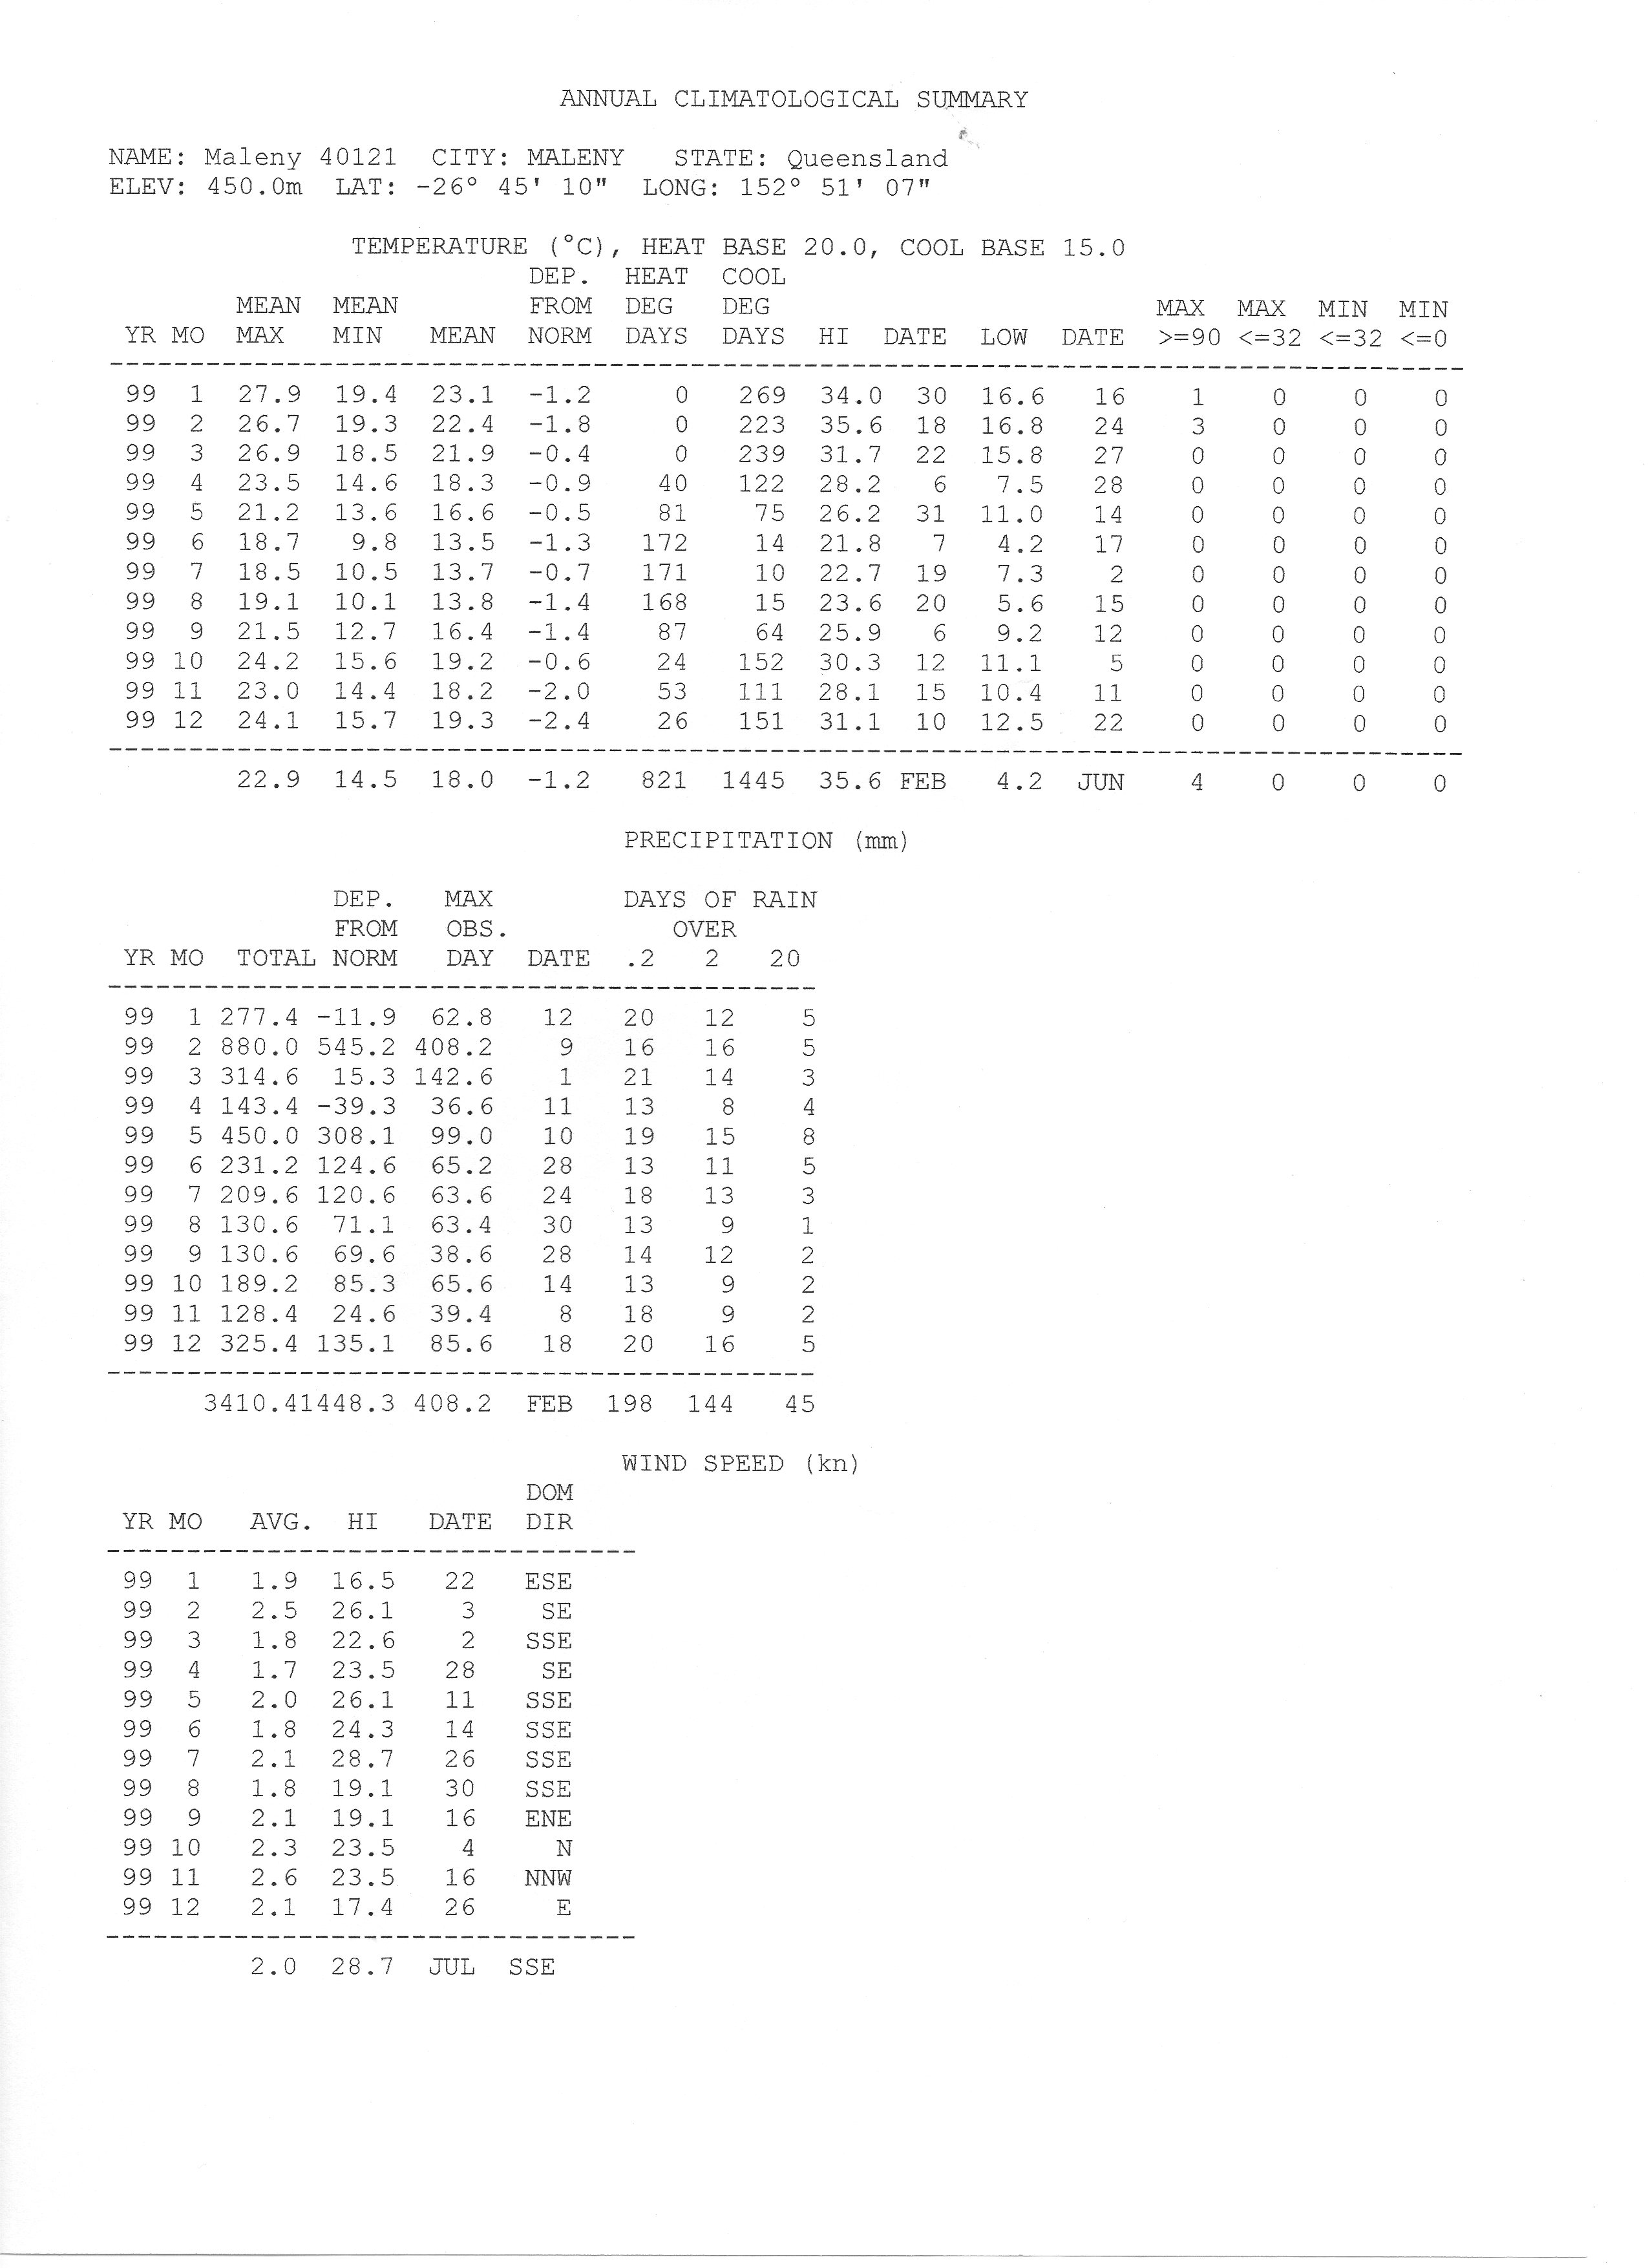
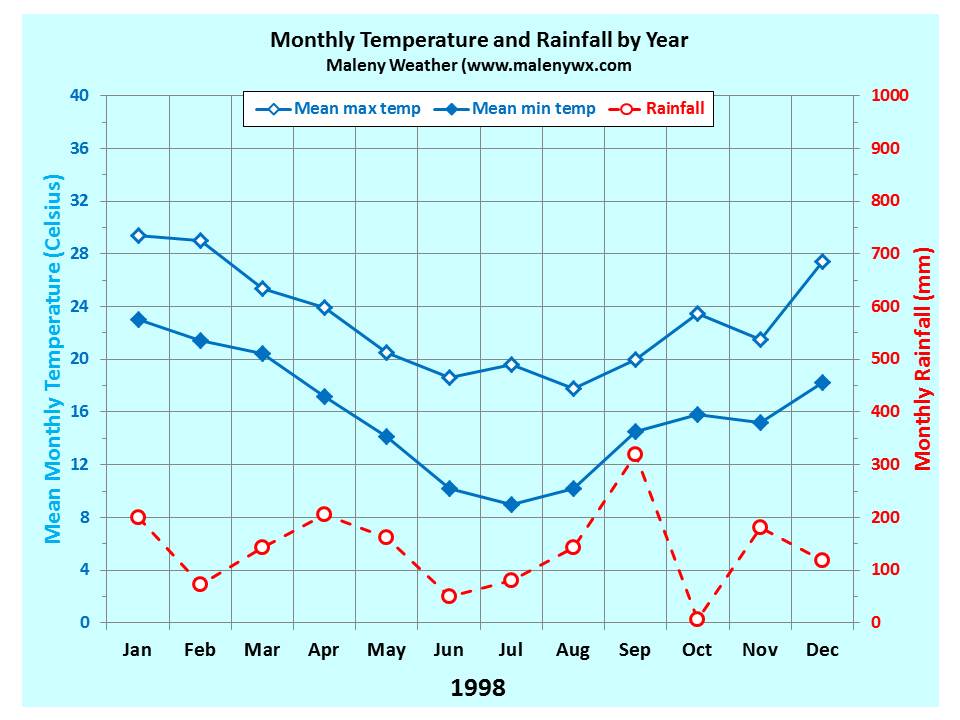
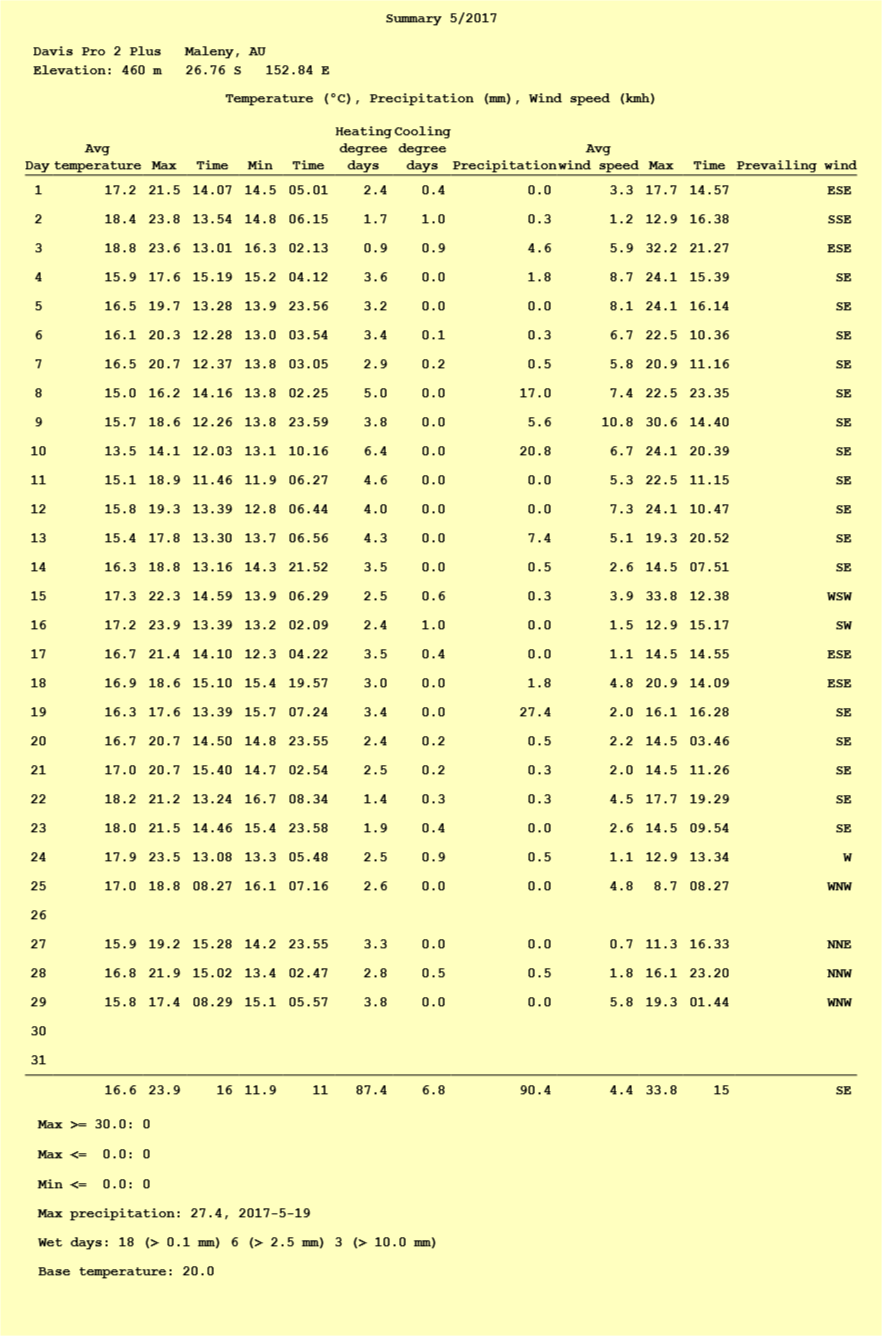
1998: In the June-July period last year, when the El Niño episode was in full swing, there was only one good northwest cloudband to cross the continent from west to east and the lack of rainfall produced dry conditions in many parts of Queensland. However, this year, during the same period, we have had 10 separate northwest cloudbands in quick succession, to bring much needed precipitation to arid areas of our State. La Nina is influencing our weather scenario. For the past few weeks we have had days of fine clear weather followed by coastal showers, before developing into more general rain as the cloudbands reaches us from the west. Understanding of the northwest cloudband has only been possible since 1 April 1960 when the first weather satellite was launched by the United States. There are now several satellites in orbit that between them provide a comprehensive coverage of the earth and its cloud systems, either as a visible imagery (VIS) or by Infrared (IR). The Satellite picture in your daily paper or on TV is an Infrared ‘white’ imagery that shows up the tops of the cloud surface on account of its very cold temperature against a grey background of warmer lower level cloud and even darker earth and sea temperature. When rain occurs over central Australia it is often heralded by a vast band of high and middle level cloud moving in from the northwest after having picked up its moisture in the Indian Ocean. July temperatures on some days were up to 7ºC above normal for this time of year and no frost was recorded during the month, although the temperature did fall to 4ºC on the last day of the month. Mean temperature was 13.9ºC and average wind speed – 4.9 kph with a dominate direction of WSW. Maleny’s total rainfall for July was 79.6 mm and the highest recorded for five years but still below the ‘all years’ average of 93.5 mm, and one wonders whether this heralds the beginning of a cycle that will bring our winters back to the norm with slightly wetter weather to benefit grain growers in Queensland.
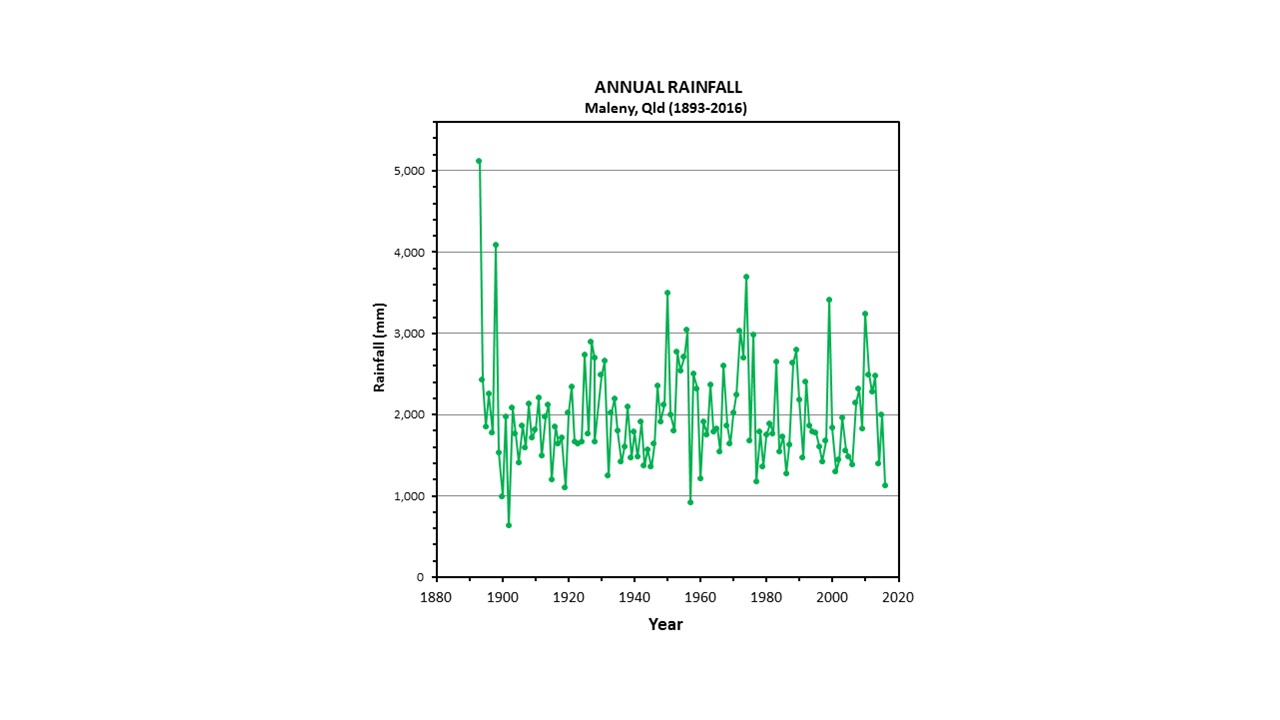
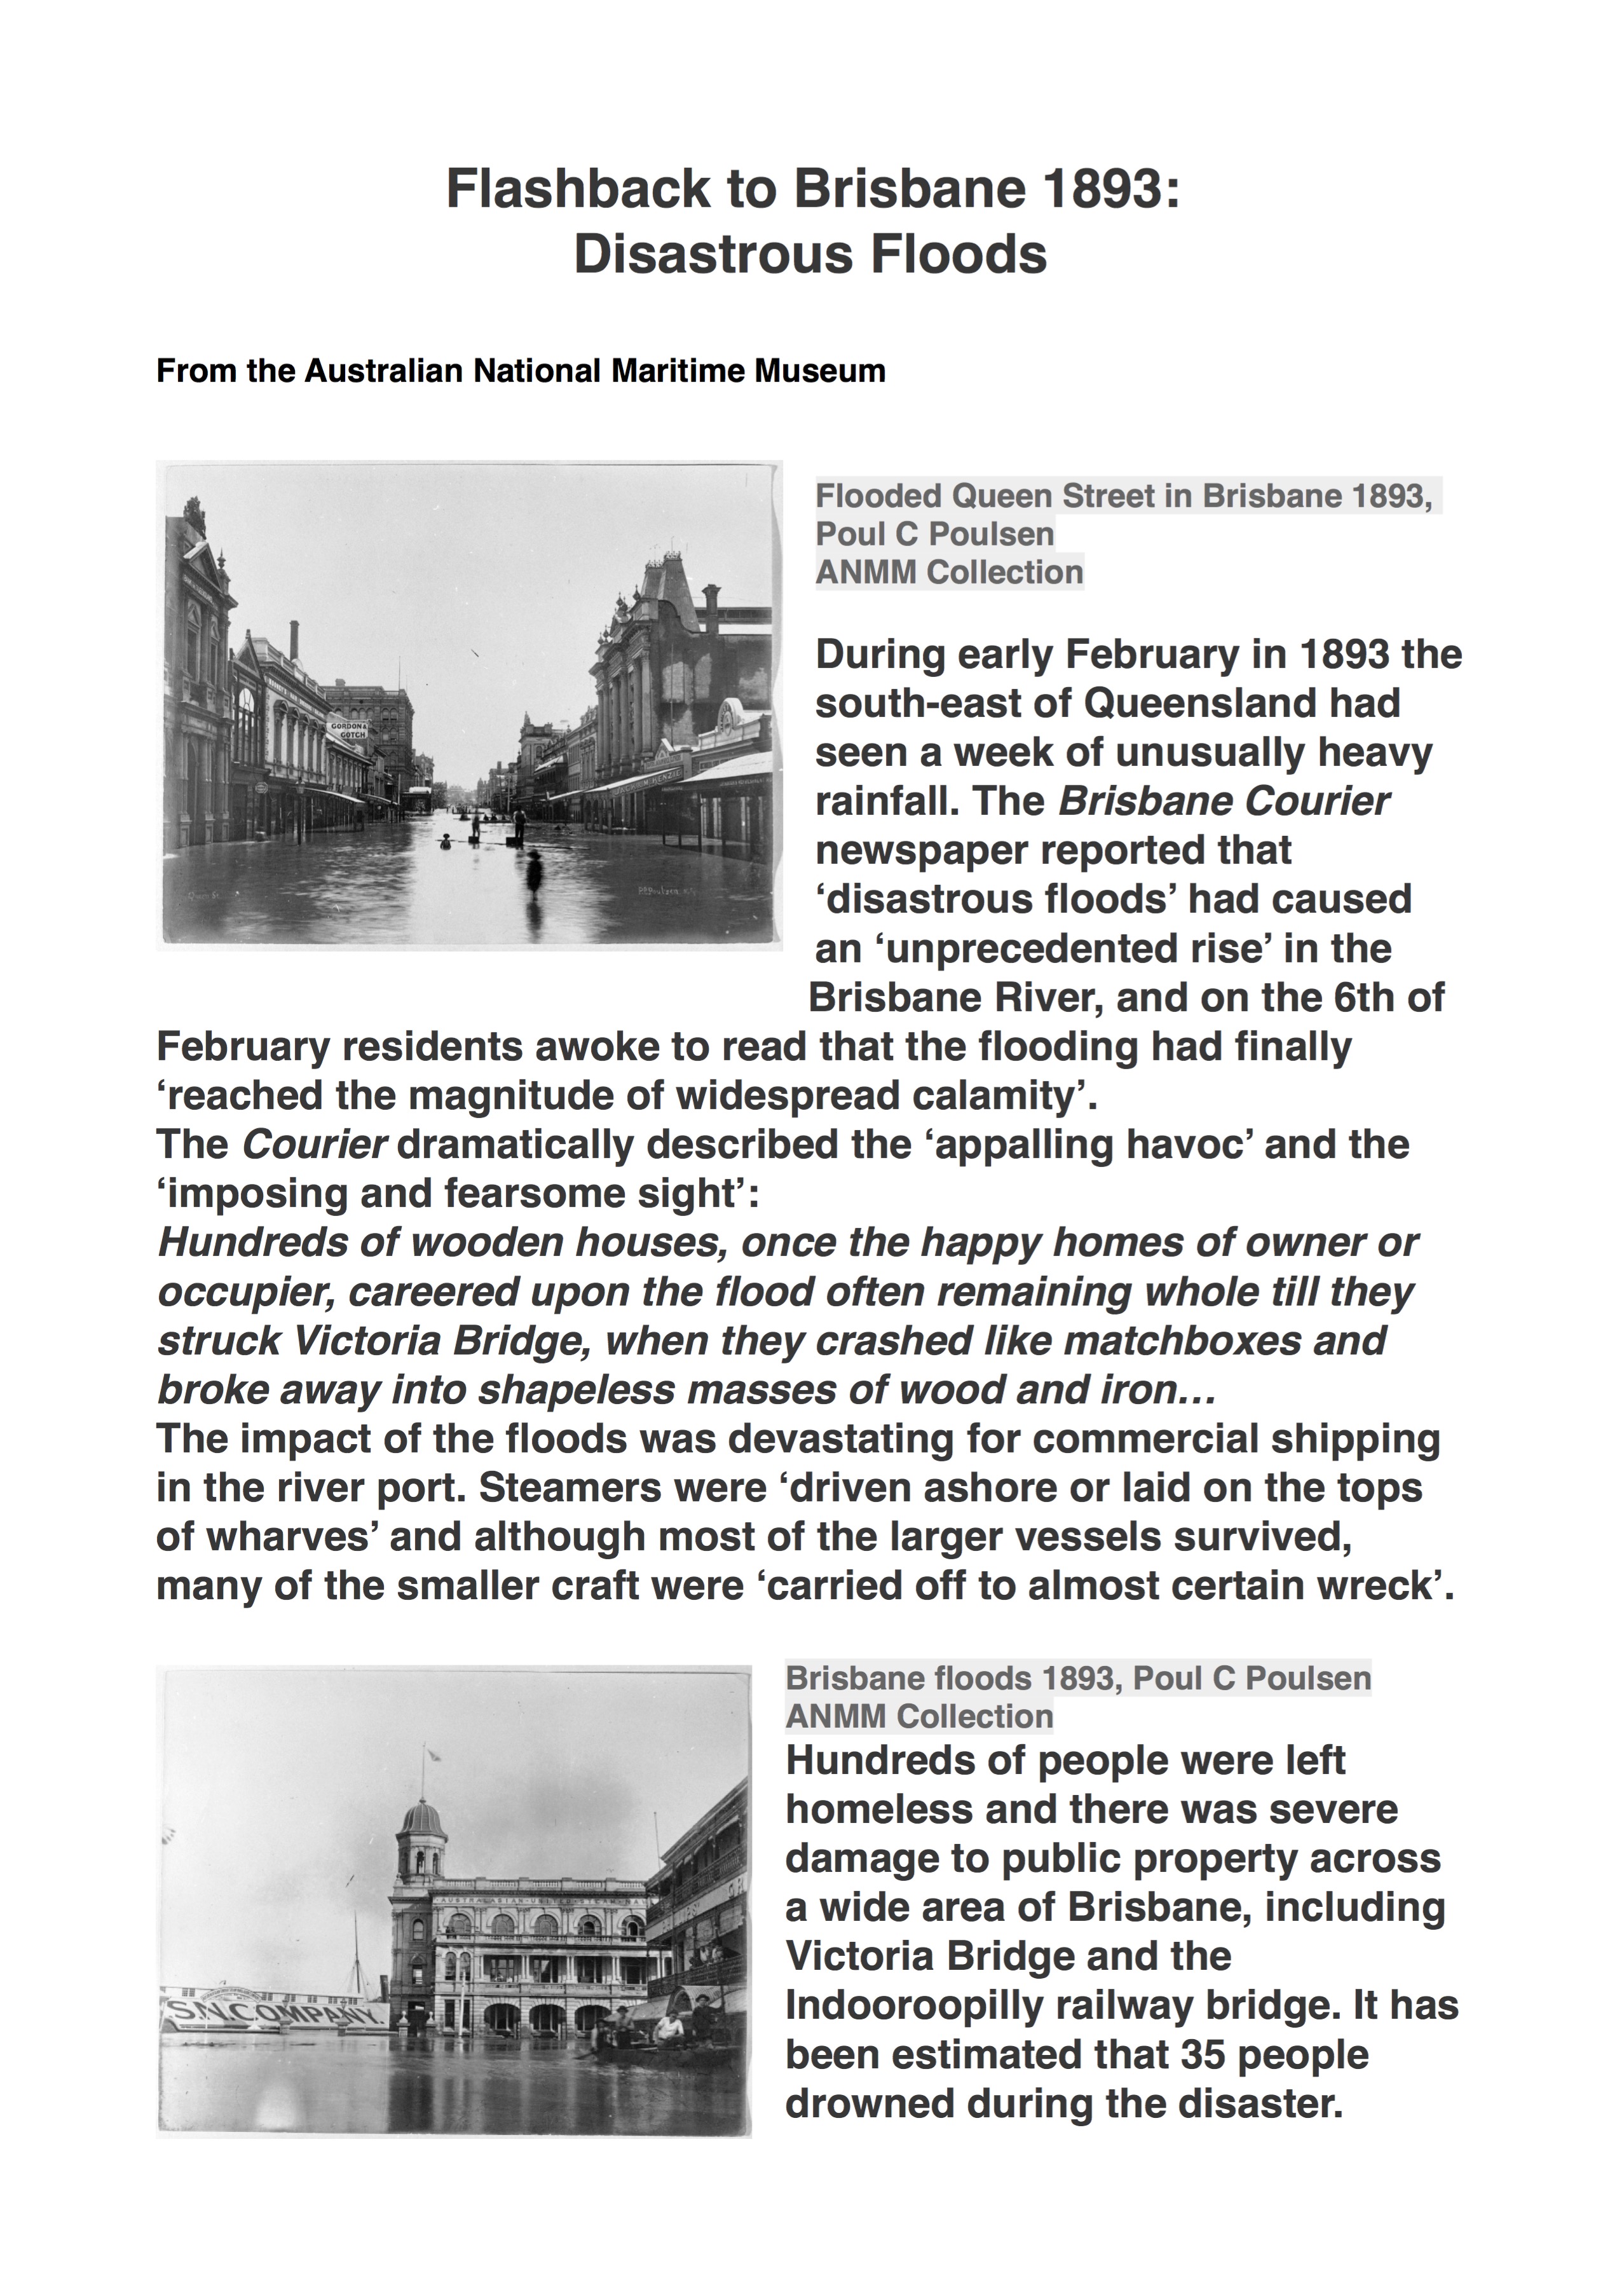
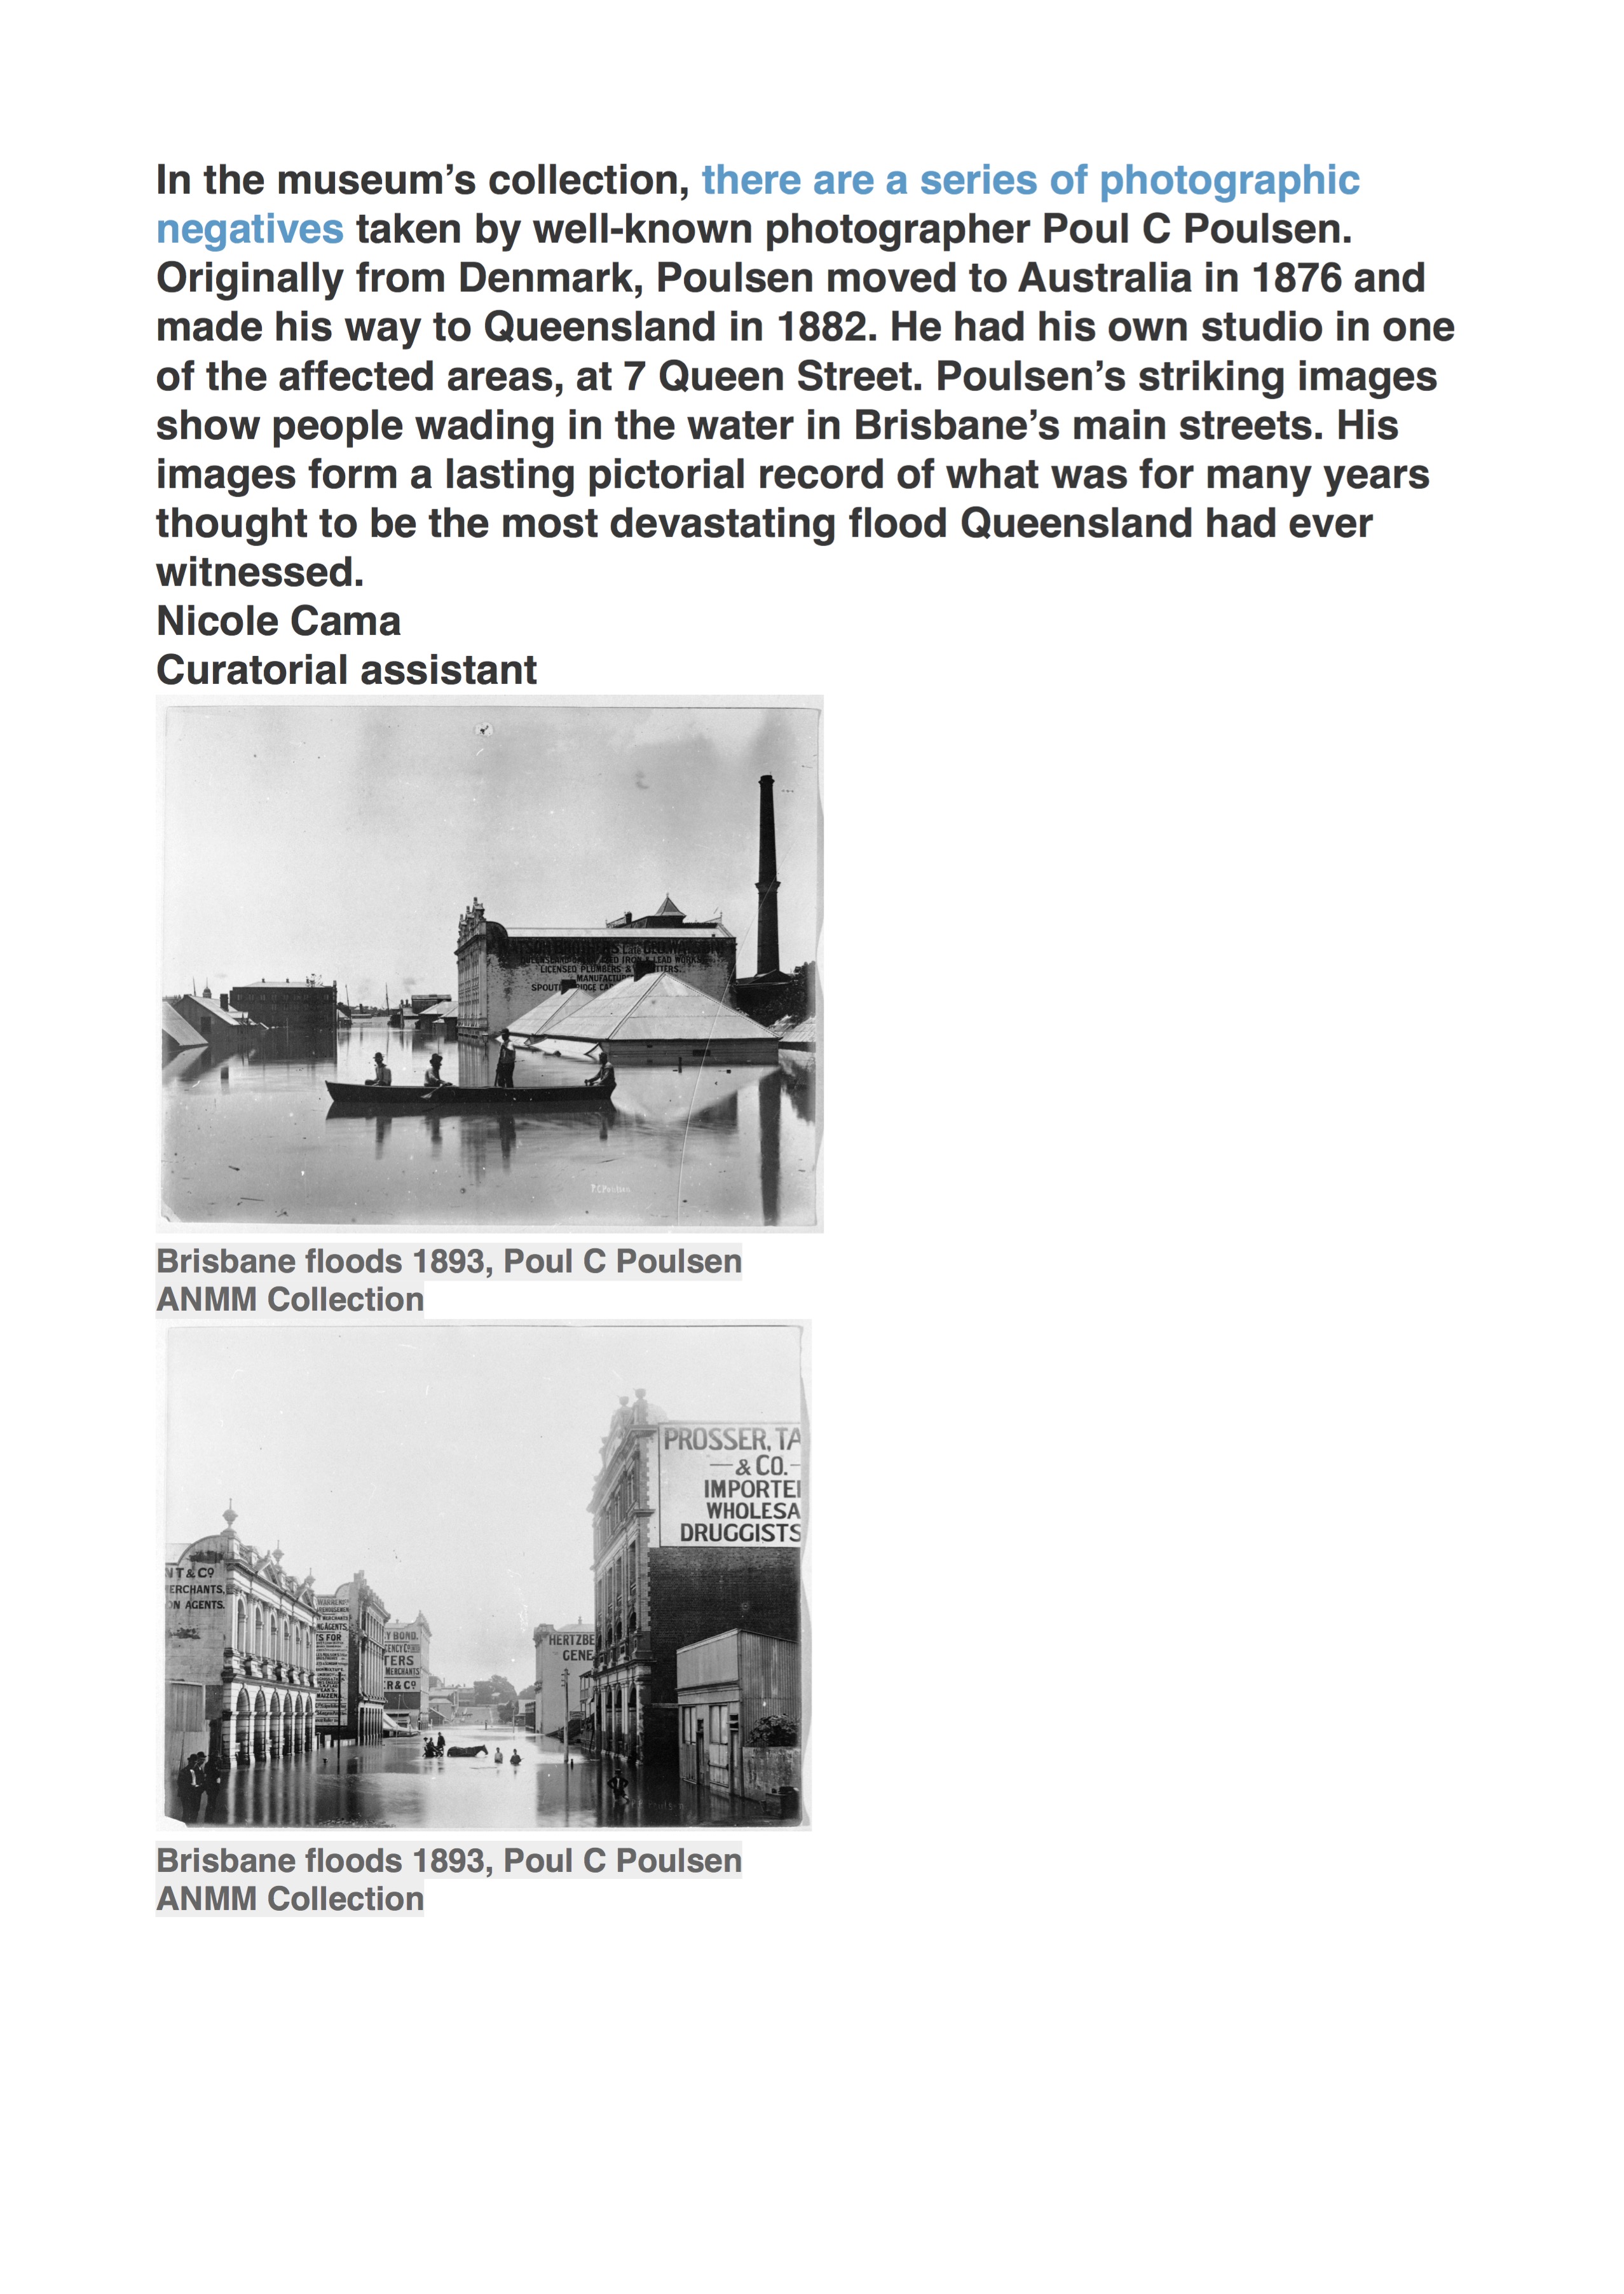
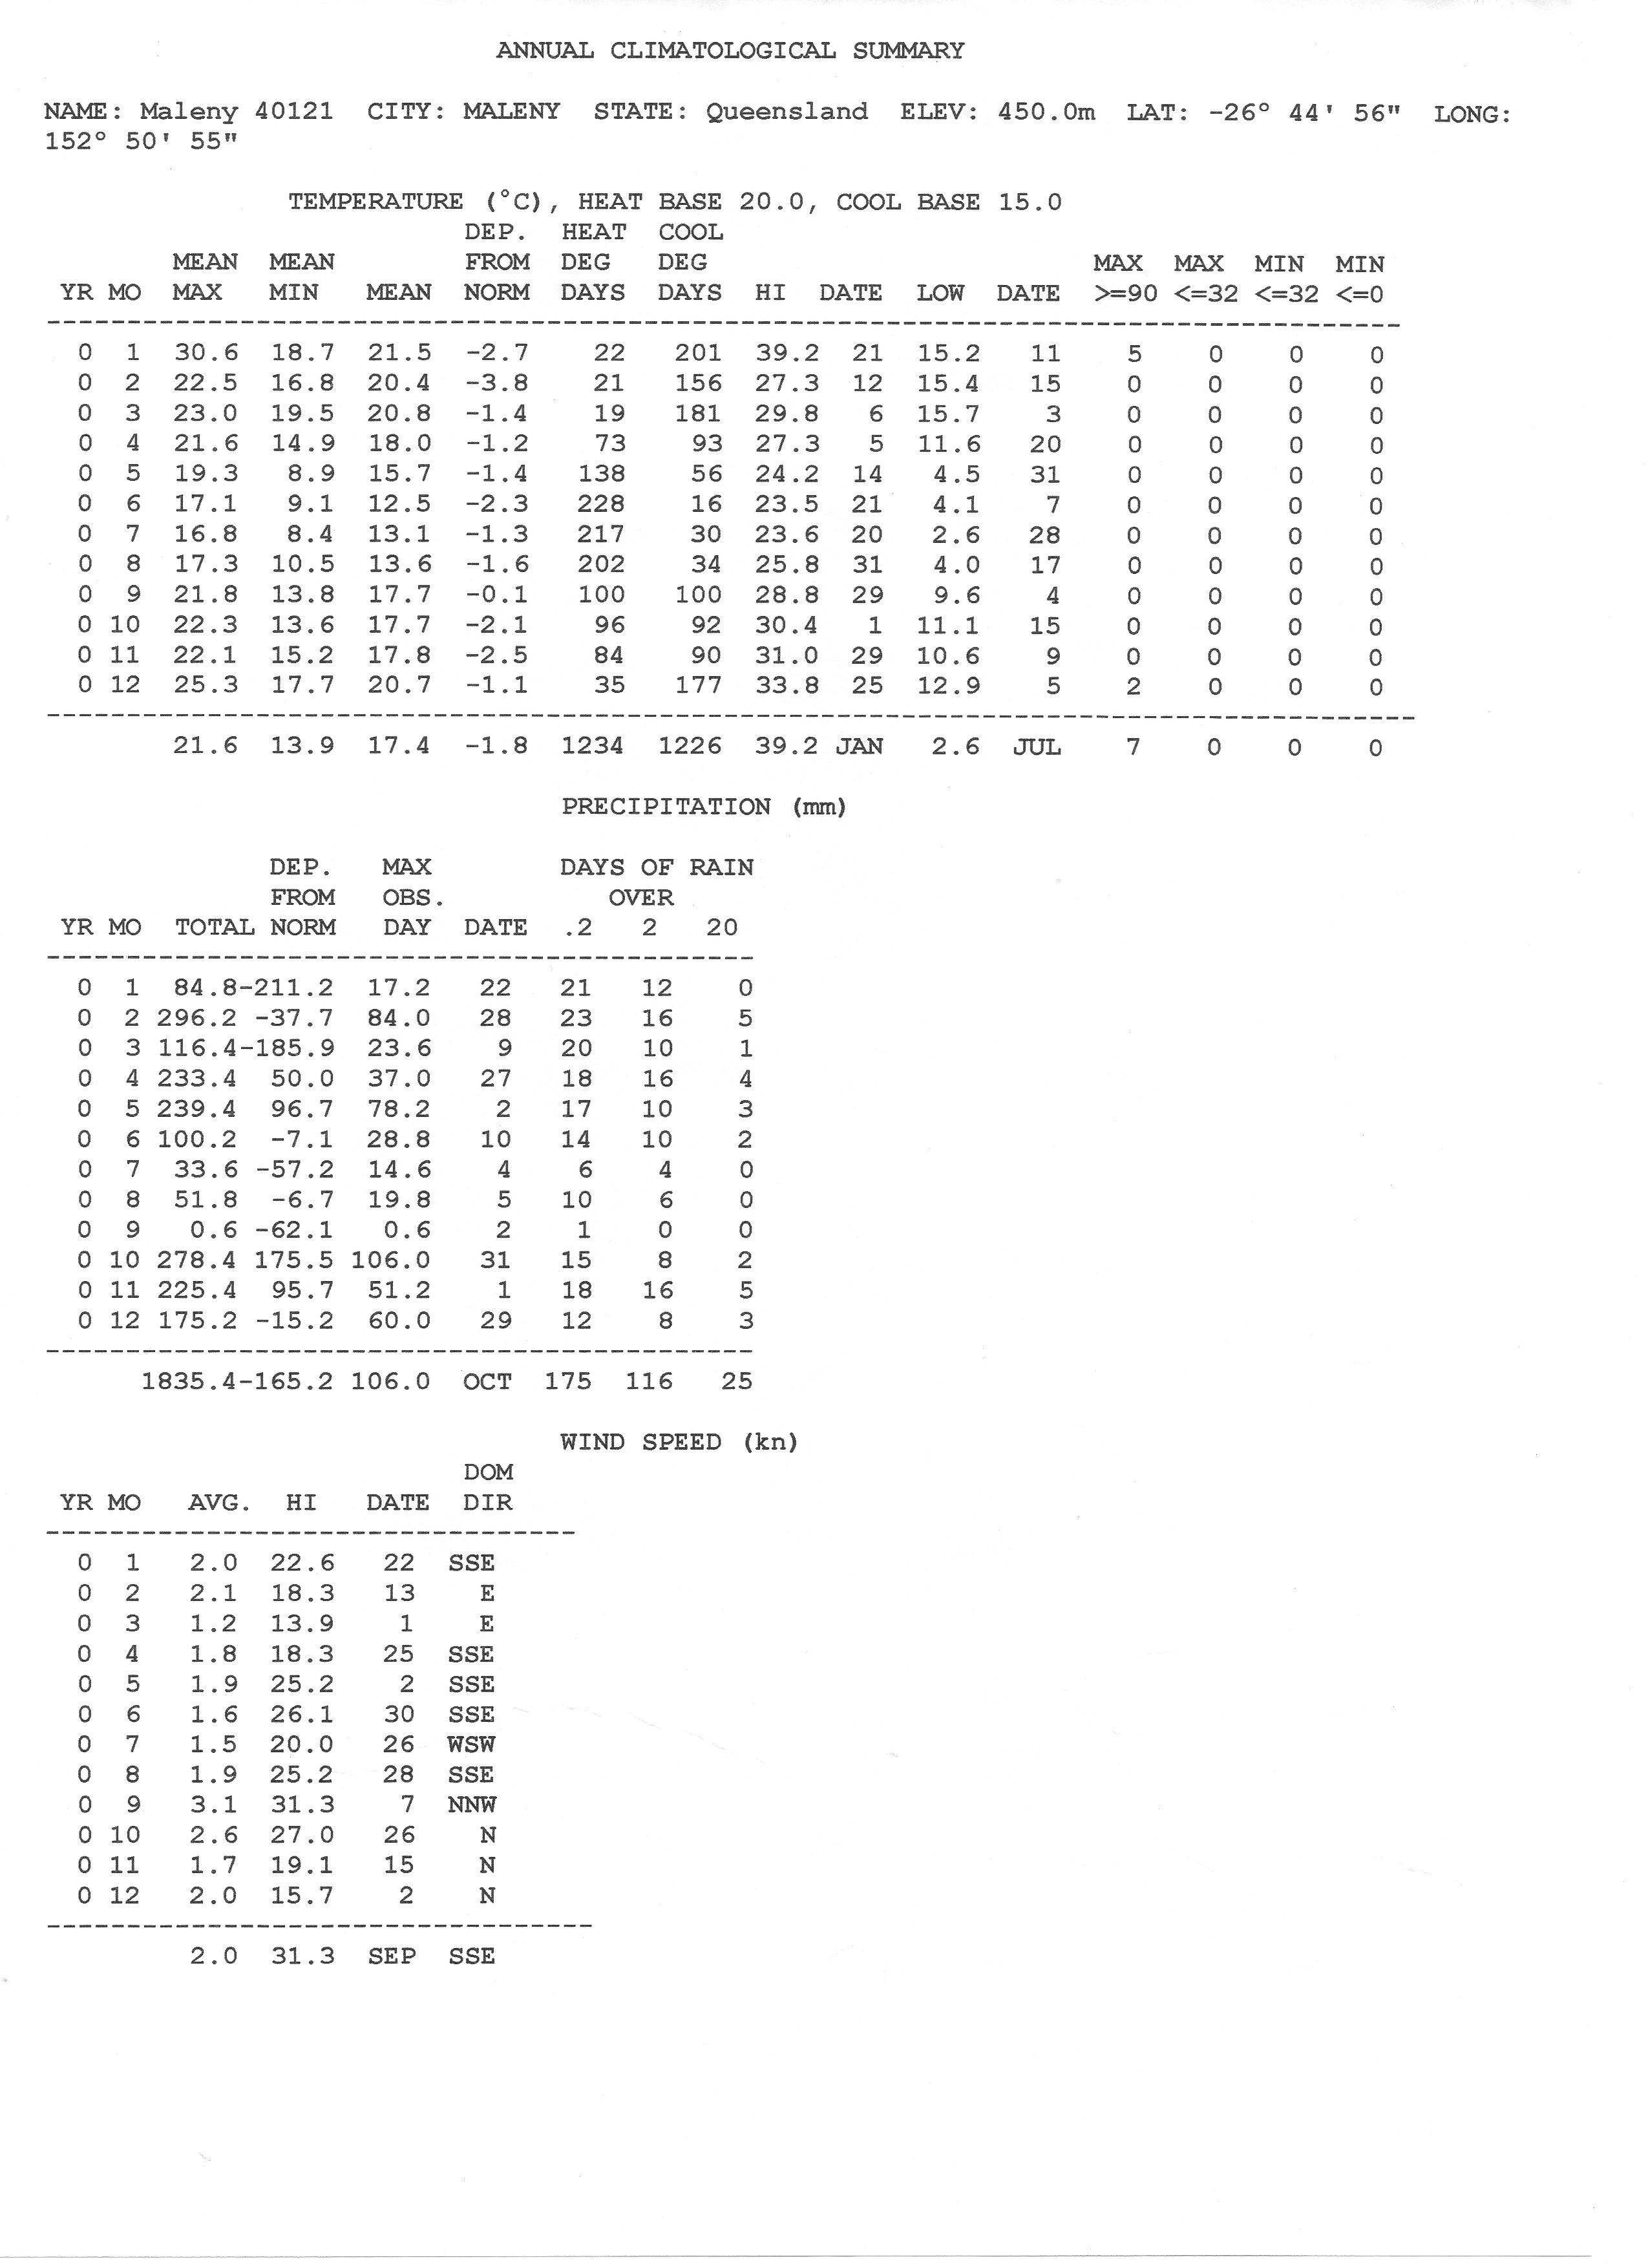
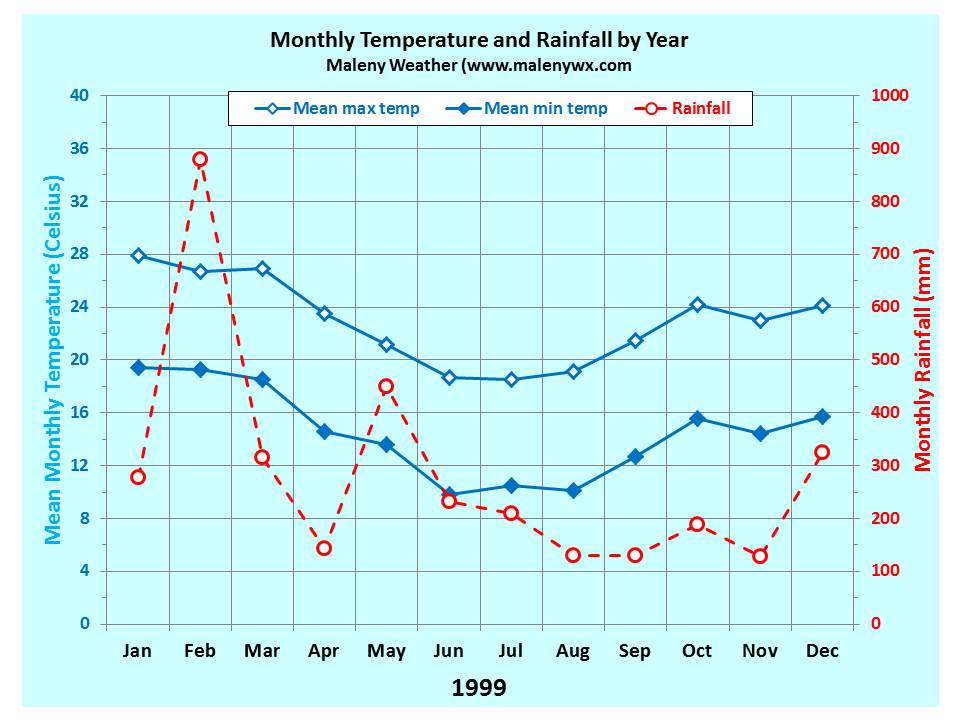
1999: Not since 1976 has Maleny had such a drenching as we experienced this year when 2,506 mm were recorded in the first 7 months – over 100 inches in the old scale! January to July peak rainfall years were 4656 mm in 1893, 3,639 mm in 1898 and 2688 mm in 1950. We ended up, just short of the 1976 total of 2545 mm. Weekend weather suffered the most with 40 wet Saturday and Sundays, compared with 30 last year over the same period. Holiday makers expressed disappointment of their hopes of long sunny days exploring Maleny’s countryside which turned out to be a dream and not a reality. Children soon became bored and long walks in the rain were not popular. Visitors returned home early and trade in the town suffered accordingly.
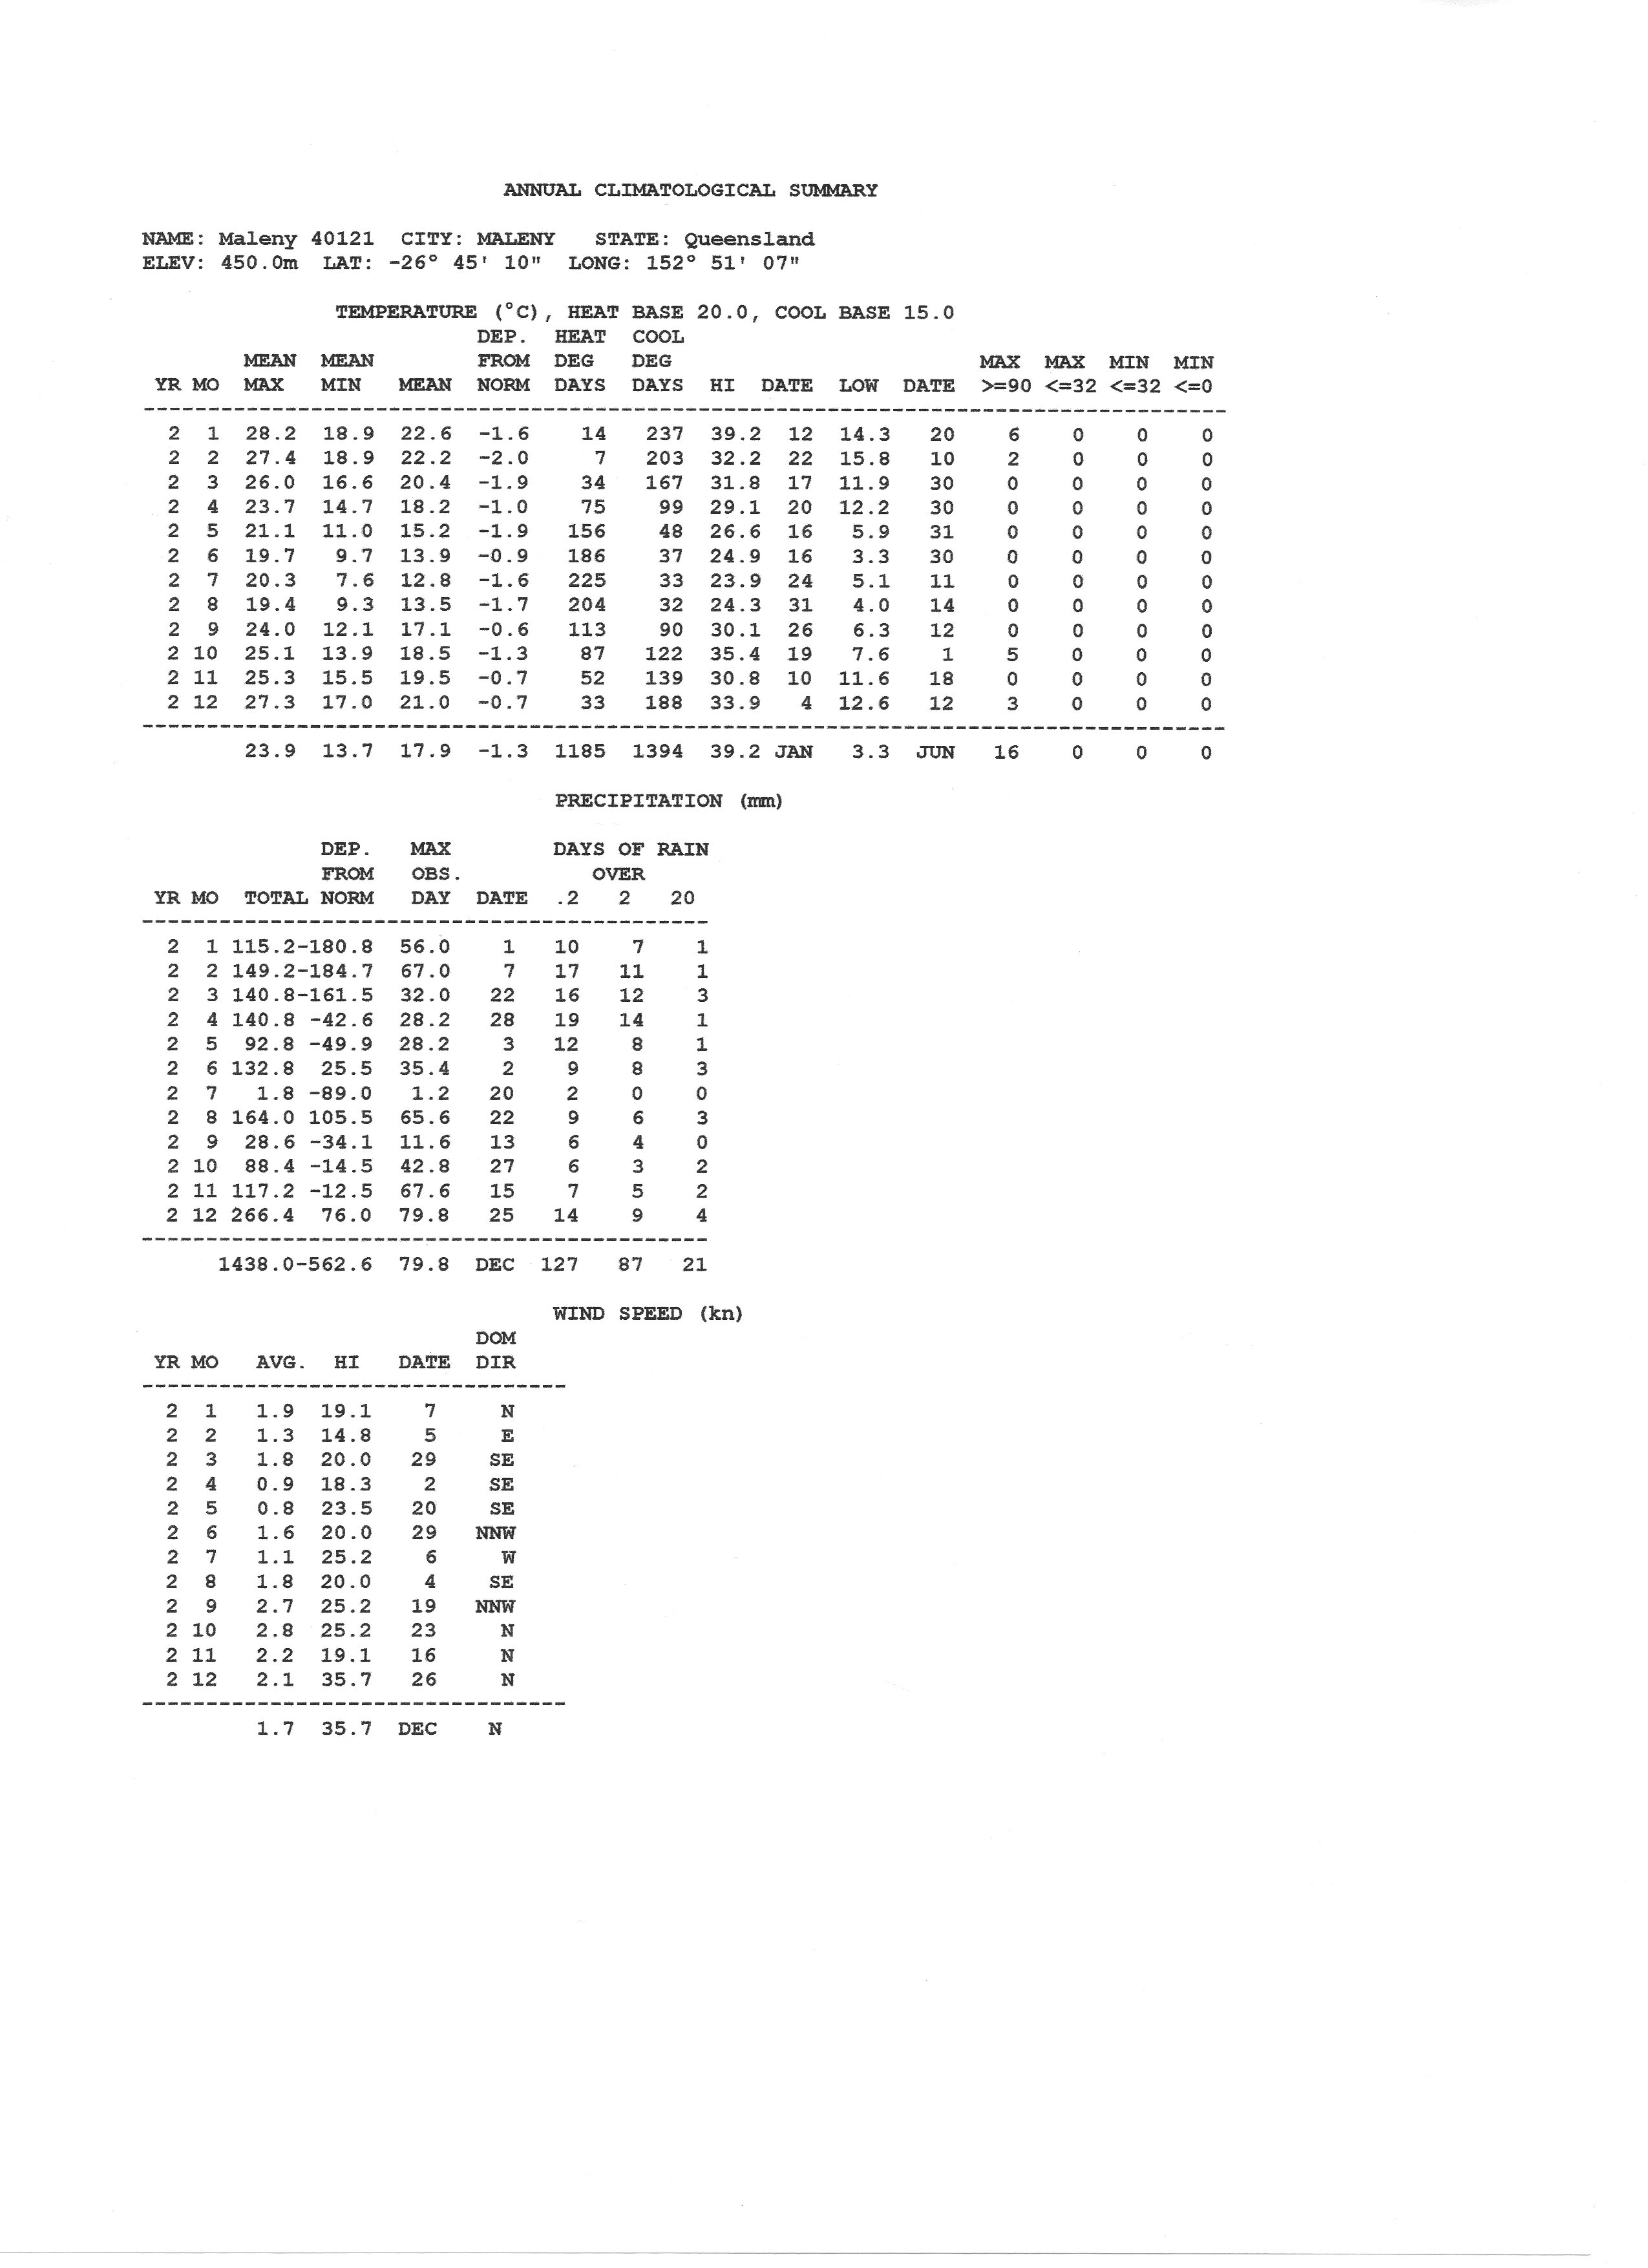
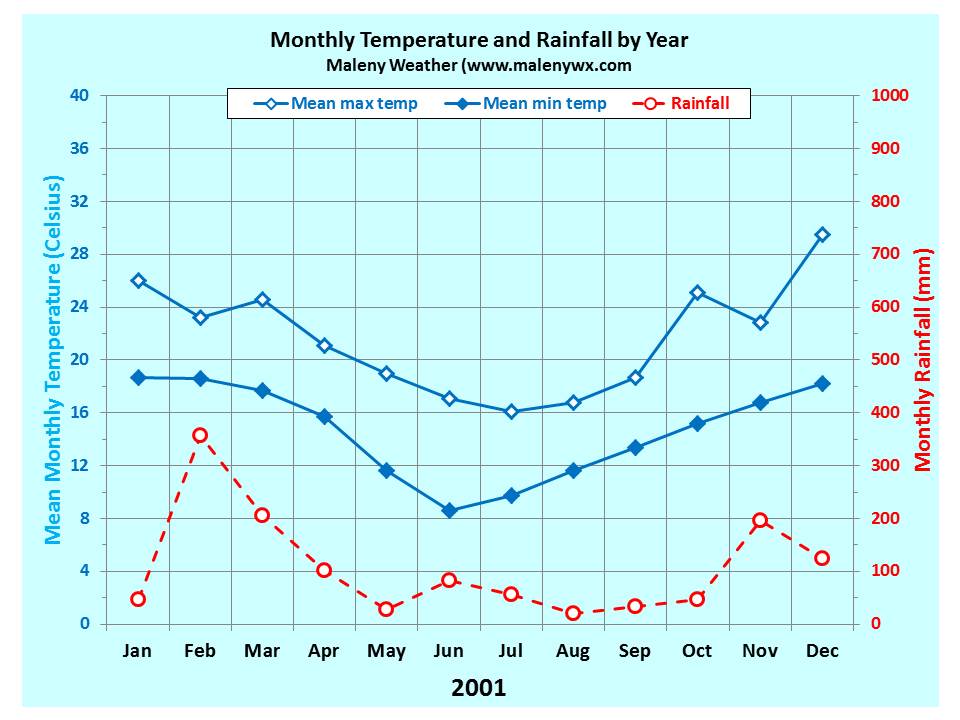
2000: July synoptic charts this year have conformed to a pattern consistent with anticyclones which normally cover the land masses of the continent during the winter months. When this is associated with deep low pressure systems in the Tasman Sea conditions are ripe for strong polar winds to be felt on the Range followed by a rapid drop in temperature. More often than not a cold frontal system will develop ahead of the change to bring shower activity, or in the case of Victoria some good falls of snow on the mountains.
On Monday 10th, a weak surface and upper level trough developed to produce a line of thunderstorms from Town of 1770 to the Brisbane area. After a day of clear blue sky a spectacular line of nimbostratus cloud approached Maleny from the southwest at 4.15 pm blotting out the sun. There were occasional peals of thunder but only minimal amounts of rainfall were recorded up to midnight. Conditions on Sunday night 16th were ideal for viewing the natural phenomena of a lunar eclipse in totality An unusual feature occurred during the night of Wednesday 26th when a deep low pressure cell in the Tasman Sea and a strong anticyclone in the Bight whipped up some strong cold southerly winds from the polar region. It was not until just 15 minutes past midnight on Thursday the maximum temperature for the 24-hours was reached before plummeting to a low of 3.7ºC at noon!
Jet Streams
Jet streams are a narrow current of high-speed winds, typically thousands of kilometres long, hundreds of kilometres in width, and a few kilometres in depth, that occurs in the upper troposphere and lower stratosphere. They normally travel at about 400 kph. The maximum speed recorded was 656 kph. Commercial aircraft on trans-Australian flights make full use of the boost given by a jet stream whenever possible.
The Japanese already knew about the jet streams before the advent of satellites from their research on balloons before the Second World War, and they planned on using it to attack the North American Mainland with balloon bombs to cause mass panic and confusion with bombs, and set fire to the forest of the Pacific Northwest with incendiaries. They developed sophisticated high-altitude bomb-carrying balloons called Fugos, which were carried along in a jet stream. Of nine thousand Fugos launched, around a thousand reached America, from Alaska to Mexico, as far east as Michigan and Texas in the south-west.
Although only six people were killed, the military authorities and FBI realized the panic they could trigger in the civilian population and censored all media reports of the balloons. Special Fugo squads were set up across the country to clear up any evidence of the bombs and hush up eye-witnesses.
If the forests had not been wet from rain and snow the Fugos would have succeeded in setting them alight. And if, as the Americans feared, the Japanese added a biological germ or chemical warfare to the balloon’s arsenal the results would have been catastrophic. Ironically, the most successful Fugo attack brought down a power line to Hanford – the plutonium plant from which the atom bomb was being made.
Weather and Health
Many biometeorological studies have been undertaken and one of the first recorded was after the American Civil War when an eminent physician was interested in the effect of weather on war wounds and limb amputations. He reported falling barometer pressure, together with rising temperatures and humidity frequently produced neurologic pains in amputees. Another study during WWII confirmed this and found scarred areas of skin tissue produced the same result.
Another study found medical conditions that produce inflammation of the connecting tissues, such as bursitis and fibrositis, together with barometric pressure changes, may trigger-off changes in the internal fluid pressure and therefore pain.
The danger of extreme hot or cold weather conditions on the body is well documented. Also the danger of the sun’s radiation on exposed skin. But not so well documented is the growing evidence that a combination of weather conditions can trigger-off existing health problems. Cases of pneumothorax, a rare condition that causes the lung to collapse without warning – always happen in clusters. Evidence from casualty wards shows that lungs collapse just after a change in atmospheric pressure. Respiratory complaints may be triggered off by atmospheric pressure changes, humidity, temperatures, either singly or by a combination of all three. There is a growing need for more research into the subject of weather and society. If you have an existing medical complaint that seems to get worse at certain times why not keep a plot of the weather conditions and see whether there is any connection.
The Maleny Weather Station has plots available for local residents on request.
Carbon Dioxide Emissions: Impact on Plants Appetite for Water
It’s not often we come across a good news story about climate change and the future of our rivers. New research has found that river flows are set to increase by six per cent by the end of the century as plants stop soaking up as much water in a warmer world.
UK researchers have found that rising carbon dioxide (CO2) levels could have potential benefits for drier parts of the world – because plants become less thirsty. Richard Betts and his colleagues from the Hadley Centre in Exeter have found that a doubling of CO2 concentrations compared with pre-industrial levels, which is predicted within the next 50–100 years, will result in six percent more water in rivers because of more runoff from the land. This greater availability of water occurs because higher CO2 levels cause plants to use less water.
The undersides of a plant’s leaves are peppered with tiny pores called stomata, which can be opened to allow plants to soak up the CO2 they need for growth from the atmosphere. The CO2 enters the leaf by dissolving in a layer of water spread over the surfaces inside each of the stomata. But this water constantly evaporates into the air in a process called transpiration, which is why plants need a continuous supply from their roots. Higher CO2 levels, however, mean that plants don’t need to open their stomata as wide or for as long to obtain the same amount of carbon dioxide, which cuts down their water usage. And what the plants don’t drink then ends up back in rivers.
The team reached their conclusions, which are published in this week’s Nature, by using the same climate models which are used to predict day to day weather forecasts which are well tested and considered to be reasonably accurate. ‘This indicates that freshwater resources may be less limited than previously assumed,’ says Betts. (Credited to Chris Smith 31/8/2007.)
Your Garden Climate
What’s the climate like in your back garden? If you live on the Blackall Range then the chances are you have your own personal ‘microclimate’. Climate and climatic change is a big topic and one not clearly understood by most people – so where do we start?
Climatology is a study of the earth’s various climates and their impact on the natural environment. For years we have talked about the main ‘climatic zones’ of the earth as being boreal, continental, desert, maritime, Mediterranean, mountain, polar, subtropical, temperate and tropical. A relatively simple sub-division was introduced in 1900 known as the Kőppen classification, taking in such factors as annual and monthly and seasonal means for temperature, wind and rainfall, types of flora and fauna etc.
In this day and age the climate of a particular locality, for practical purposes, is the result of at least 30 years of recording frequencies of main climatic elements, including precipitation, temperatures, relative humidity, bright sunshine, cloudiness, grass temperature, wind velocity, evapotranspiration and soil temperatures at various depths. The data is usually expressed in terms of an individual calendar month, or a season.
There are three scales of climate. The macroscale climate is concerned with the broad features of climate that are governed by large scale atmospheric circulation systems. The horizontal scale varies between 500 km to 5000 km and the vertical scale extends through the whole troposphere.
Next comes the mesoscale with a horizontal scale of between 1 – 100 km, a vertical scale of between 1 – 10 km and often referred to as ‘local climate’.
Then there is microclimate. This scale deals with meteorological phenomena with a horizontal scale of up to 100 m and a vertical scale of about 10 m. The vertical variation is largely due to nearness of ground, causing for example turbulence and frictional drag. The horizontal variations are caused by changes in slope, aspect, soil moisture and soil nature, and vegetation types and height.
On the Blackall Range there is not just one microclimate but several, each according to the horizontal variations quoted above. Therefore, the microclimate in Witta can differ from Montville, and between Mapleton and Maleny.
The Maleny Weather Station records data for the climatologists at Melbourne but it will take many more years to establish with any confidence a ‘local climate’ for the area. However, with advance technology and with perhaps a ‘state of art’ Australian owned weather satellite it will be possible to establish microclimate for any location in Australia at a flick of a button.


. SOURCE: State of the Climate, 2014. SOURCE: Bureau of Meteorology and CSIRO")